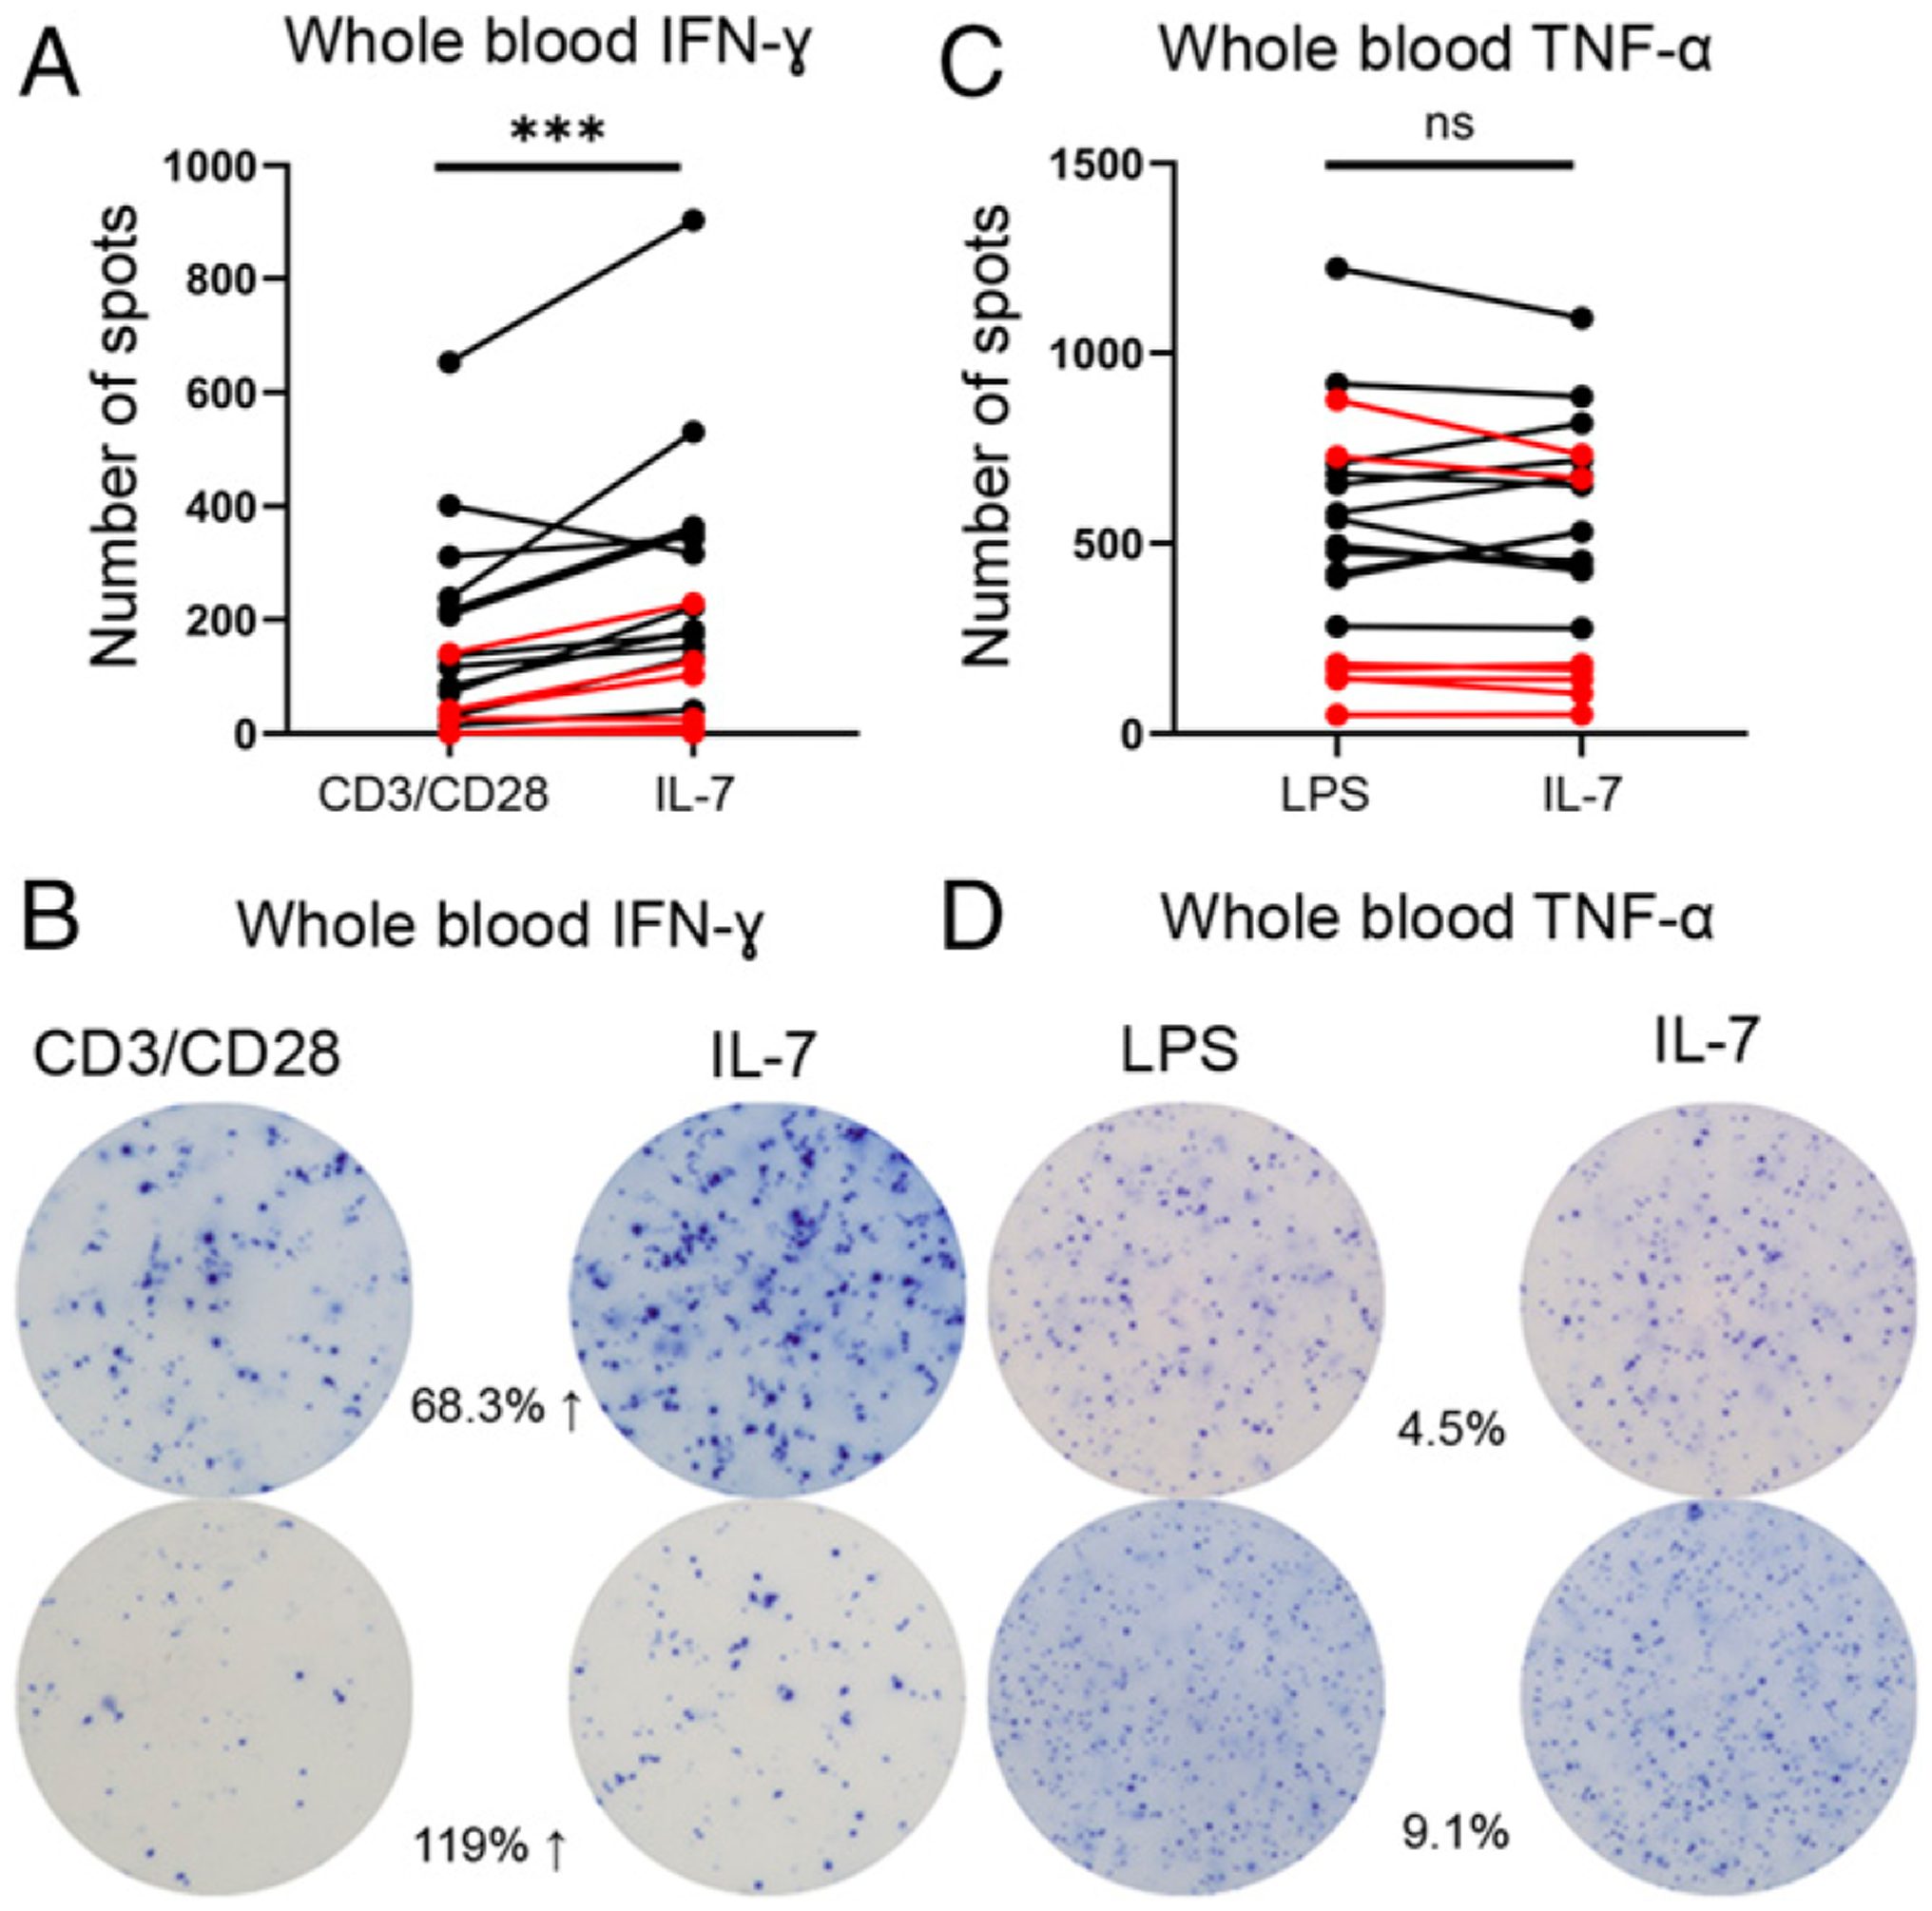
FIGURE 9.

IFN-γ and TNF-α production in response to ex vivo IL-7 administration based on whole blood ELISpot assay in patients with sepsis. (A) Change in number of IFN-γ spots (SFU) in CD3/CD28 versus CD3/CD28 + IL-7–stimulated cultures (n = 19). (B) Representative ELISpot images showing the change in the number of IFN-γ spots in CD3/CD28 versus CD3/CD28 + IL-7–stimulated cultures. (C) Change in the number of TNF-α spots (SFU) in LPS versus LPS + IL-7–stimulated cultures (n = 19). (D) Representative ELISpot images showing the change in number of TNF-α spots in LPS versus LPS + IL-7–stimulated cultures. (A and C) The number of spots are the total number of spots per well and are not corrected for volume or cell number. Lines in red depict mortality. Statistical analysis performed using paired Wilcoxon ranked sum test. ***p < 0.001.
