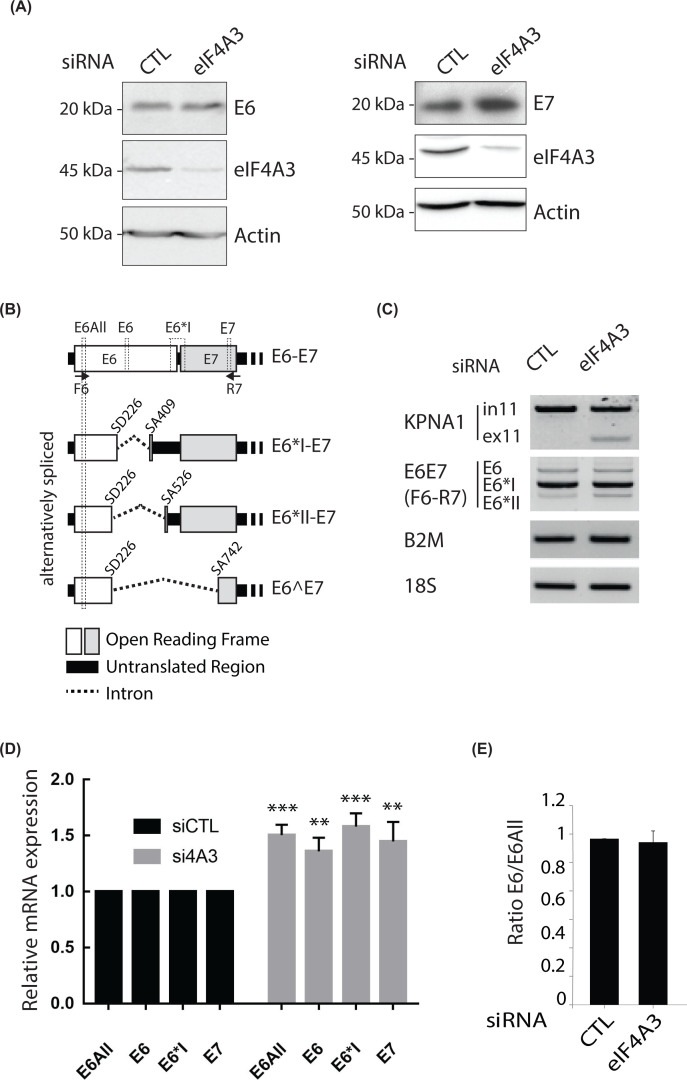
Figure 2. The depletion of eIF4A3 increases HPV16 E7 protein expression.
(A) Western blotting analyses showing endogenous E6 (left panel), E7 (right panel) and eIF4A3 protein levels in CTL or eIF4A3-depleted SiHa cells. β-actin was used as a loading control. (B) Representative scheme of unspliced and alternatively spliced HPV16 early transcripts. Real-time PCR primer sets are in dotted lines (E6All, E6, E6*I and E7) and RT-PCR primer sets are represented by arrows (F6 and R7). (C) RT-PCR showing alternative splicing patterns of HPV16 E6/E7 transcripts in CTL or eIF4A3-depleted SiHa cells. KPNA1 was used as a positive control of eIF4A3 depletion efficiency. B2M and 18S were both used as loading controls. (D) RT-qPCR analysis of HPV16 E6all, E6, E6*I and E7 expression in SiHa cells treated with siRNA-CTL or siRNA-eIF4A3 for 48 h. 18S was used for normalization. Data are represented as means of seven independent experiments. Error bars = s.e.m.; **P<0.01; ***P<0.001; two-tailed Student’s t test. (E) E6/E6All ratio of mRNA levels quantified by real-time PCR in CTL or eIF4A3-depleted SiHa cells. Data are represented as means of seven independent experiments. Error bars = s.e.m.

