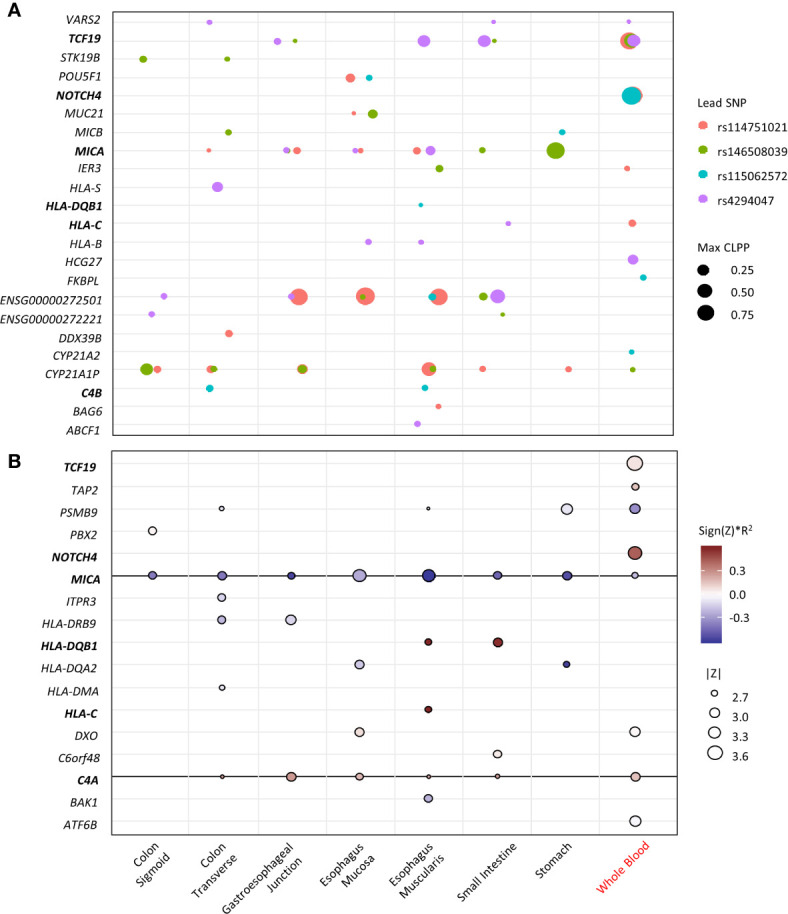
Figure 3.

Fine-mapping of the top loci. X-axis represents the tissue types (black indicates GI-tissue). Y-axis represent the genes. Genes that appear in both eCAVIAR and MetaXcan are in blood. (A) Colocalization of the 4 lead SNVs at the MHC region. The dot size represents the maximum CLPP values in the corresponding locus and tissues. The color represents different locus for each lead SNV. (B) MetaXcan associations of the MHC region with CDI in antibiotic subgroup. The size of the dots represents the significance of the association between predicted expression and the CDI in patients exposed to high-risk antibiotics. Red indicates positive correlation while blue negative. Darker color indicates larger genetic component and consequently more active regulation in the tissue (R2 is a model performance measure computed as the correlation squared between observed and predicted expression, cross validated in the training set). Only associations with p<0.01 were shown.
