FIGURE 1.
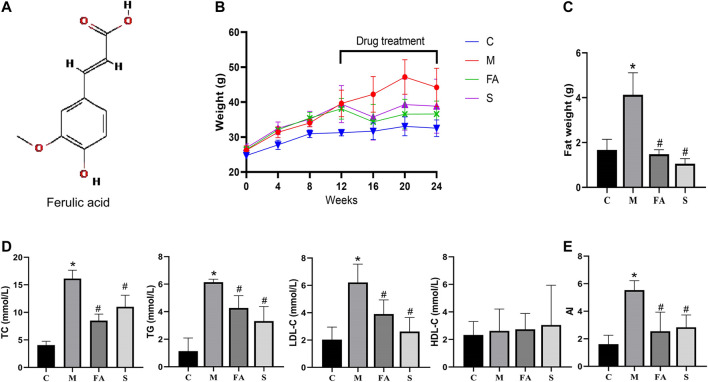
FA regulated lipid levels in HFD-fed ApoE−/− mice (A) Chemical structure of FA. (B) The change of body weight. (C) Abdominal adipose weight of mice. (D) Levels of serum lipids (TC, TG, LDL-C, HDL-C) in per group. (E) Atherogenic index of various groups. Control group (C), model group (M), Ferulic acid treatment group (FA), simvastatin treatment group (S). n = 4. *p < 0.05, **p < 0.01; as compared to the control group. # p < 0.05; as compared to the model group.

