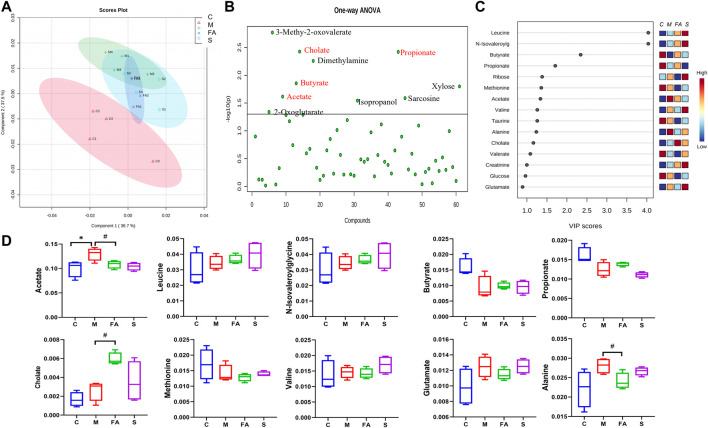
FIGURE 8.
The Effect of FA on gut microbiota metabolite in ApoE−/− mice. (A) The PLS-DA Scores plots in per group. (B) One-way ANOVA plots of metabolite among groups. The metabolite above the horizontal line had a difference among groups with p < 0.05. (C) The metabolites with VIP values >1.0 were regarded as important. Red and blue indicated increased and decreased levels, respectively. (D) The content of differential metabolites (acetate, leucine, butyrate, propionate, Cholate, valine, Glutamate and alanine) among groups (n = 4). # p < 0.05; as compared to the model group.

