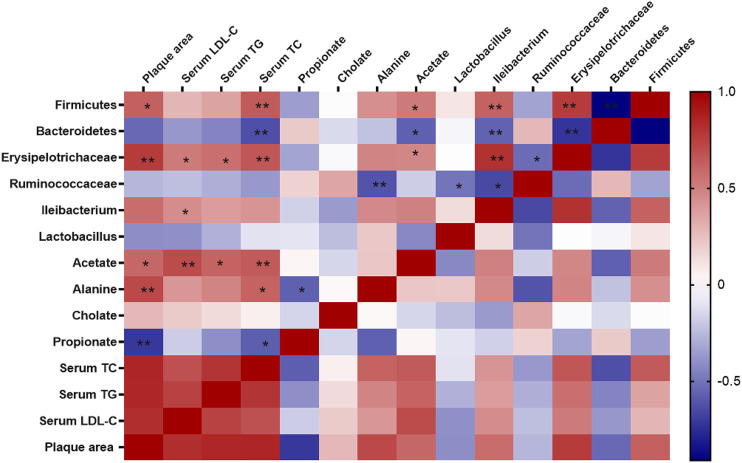
FIGURE 9.
Correlations between gut microbiota and atherosclerosis. Spearman correlation analysis (heatmap) was used to analyze the correlations between gut microbiota and physiological indices including serum levels of lipids and plaque area. The correlation analysis value was represented by colors of grids. Red stood for positive correlation and blue for negative correlation. The deeper red or blue represented higher correlation values. *p < 0.05, **p < 0.01.

