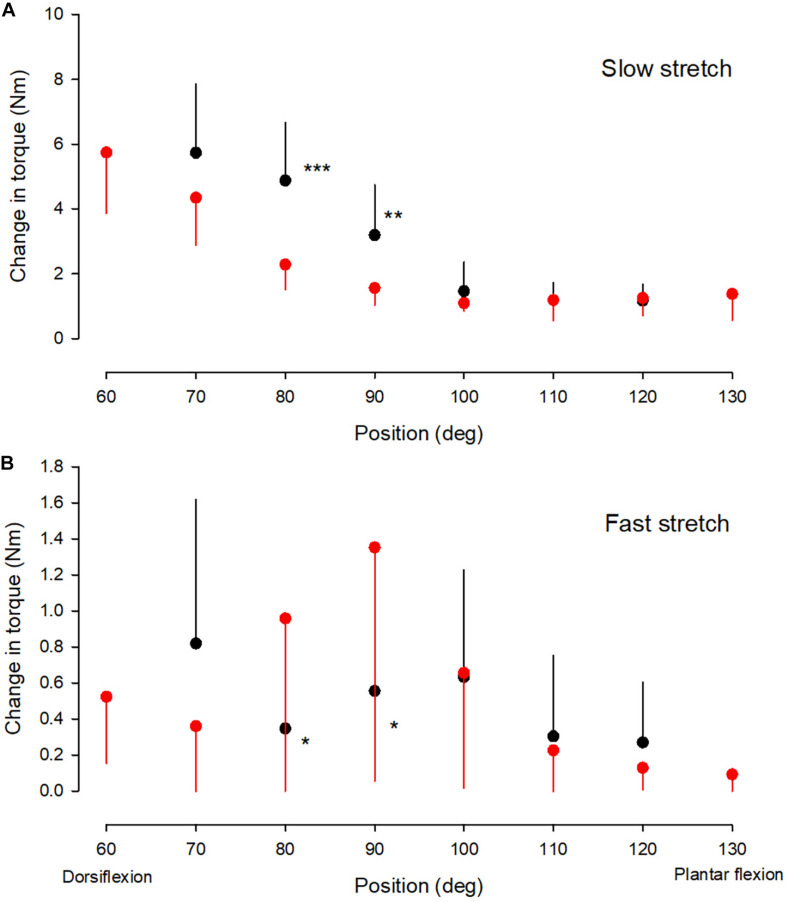
FIGURE 2.
Torque values. The change in passive torque (A) and reflex torque (B) of the ankle plantarflexor muscle-tendon unit at different ankle joint positions throughout the range of movement in the NI (red circles) and CP group (black circles). It was not possible to obtain measurements at joint positions of 60 and 130 deg in the majority of adults with CP and only measurements from the NI group are therefore shown for these two positions. It was possible to obtain measurements from 7 of the 13 adults with CP at 70 deg and these measurements have therefore also been included. For the remaining positions measurements were obtained from all subjects. Each symbol represents the mean of all measurements in each of the groups at the respective ankle joint positions. Each vertical bar is 1 SD. Statistically significant differences in measurements between the two groups are indicated by stars. *p < 0.05, **p < 0.01, ***p < 0.001.

