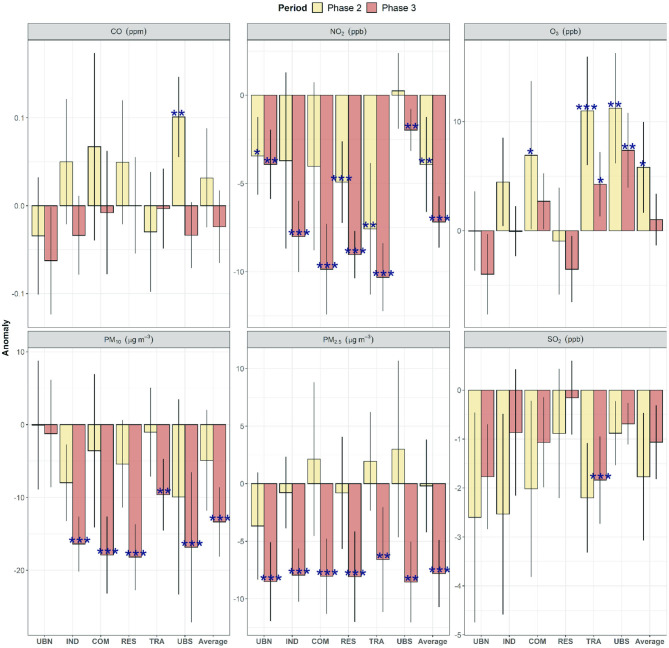
Figure 6.
Net changes in anomalies of criteria air pollutants during lockdown Phases 2–3 in comparison to 2016–2019 anomalies as baseline within the MCMA. The stars show significant changes during the COVID-19 lockdown calculated with the non-parametric Wilcoxon test, while the vertical bars show the 95% confidence intervals. *Level of significance p < 0.05. **Level of significance p < 0.01. ***Level of significance p < 0.001.

