Figure 1.
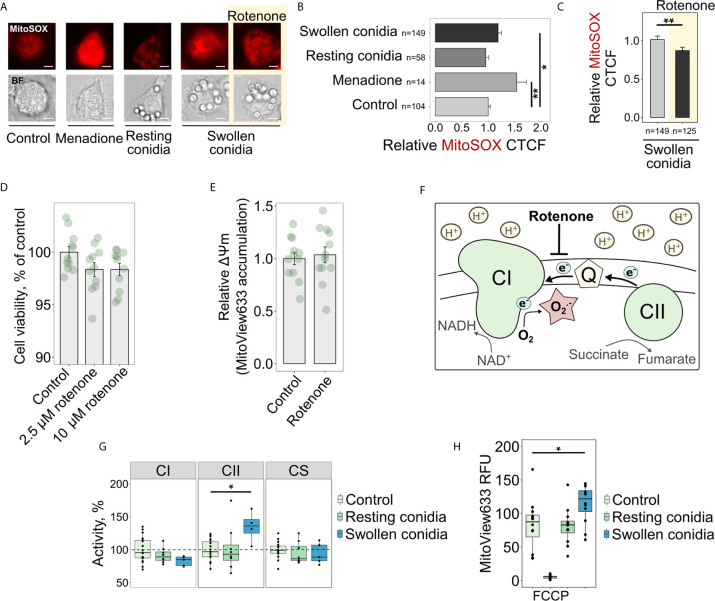
Sensing swollen conidia of A. fumigatus induces mitoROS production and increases the activity of the respiratory chain complex II and mitochondrial transmembrane potential. (A) Microscopic analysis of mitoROS in BMDMs infected with resting or swollen conidia of A. fumigatus. BMDMs were incubated with either resting or swollen A. fumigatus conidia for 2 h, stained with mitoSOX, fixed and subjected to imaging. Treatment with menadione was used as a positive control. To prevent mitoROS production through RET, BMDMs were treated with rotenone (shown with yellow background) for 1 h prior to exposure of BMDMs to swollen conidia. The scale bars are 5 µm. (B, C) The quantification of the level of fluorescence in infected macrophages. The abundance of mitoROS in BMDMs was determined by image analysis of MitoSOX-stained BMDMs with ImageJ software. A relative corrected total cell fluorescence (CTCF) was calculated in relation to an average of CTCF measured in untreated (Control) BMDMs (B) or in BMDMs exposed to swollen conidia (C). (D) Measurement of viability of BMDMs after a short-term treatment with rotenone. Viability of BMDMs measured with the resazurin assay after 1 h of exposure to rotenone followed by 2 h cultivation in R10 media and is expressed in comparison to untreated cells (Control). (E) Analysis of mitochondrial membrane potential after treatment of BMDMs with rotenone. MitoView633-associated fluorescence was measured in BMDMs following 1 h of exposure to 2.5 µM rotenone followed by 2 h cultivation in R10 media containing fluorescent probe and represented mitochondrial membrane potential. Relative mitochondrial membrane potential was calculated in relation to an average of fluorescence units measured in untreated (Control) cells. (F) Schematic of mitoROS production via reverse electron transport (RET) in mitochondria. Coenzyme Q (Q) becomes over-reduced with electrons supplied by complex II (CII) during succinate oxidation. A large membrane potential and pH gradient drive electrons from coenzyme Q to complex I (CI) resulting in superoxide (O2 .-) production at one of CI sites. Rotenone inhibits RET-induced mitoROS generation. (G) Spectrophotometry analysis of enzyme activities of mitochondrial respiratory chain complex I (CI), complex II (CII), and citrate synthase (CS). BMDMs were left untreated (Control) or exposed to resting or swollen conidia of A. fumigatus for 2 h. Enzymatic activity measured in untreated BMDMs was set as 100% in each replicate. The activity of citrate synthase was measured to assess quality of mitochondria. (H) Measurements of mitochondrial membrane potential in BMDMs by detecting fluorescence of MitoView633. BMDMs were exposed to heat-inactivated resting or formalin-fixed swollen conidia in the presence of MitoView633. MitoView633-associated fluorescence was measured after incubation overnight. Treatment with 18 µM FCCP (p-trifluoromethoxyphenylhydrazone) was used as a negative control. Data are from two (D, E, H), three (B, C), or four (G) independent experiments. “n” indicates number of cells used for quantification; bars indicate means and standard errors. Statistical significance was calculated with the Kruskal-Wallis test followed by Tukey post-hoc tests (B, H), with the Mann Whitney U Test (C), or Student’s (D, E) t-test, or one-way ANOVA followed by Tukey post-hoc tests (G): * indicates p<0.05, and ** indicates p<0.01.

