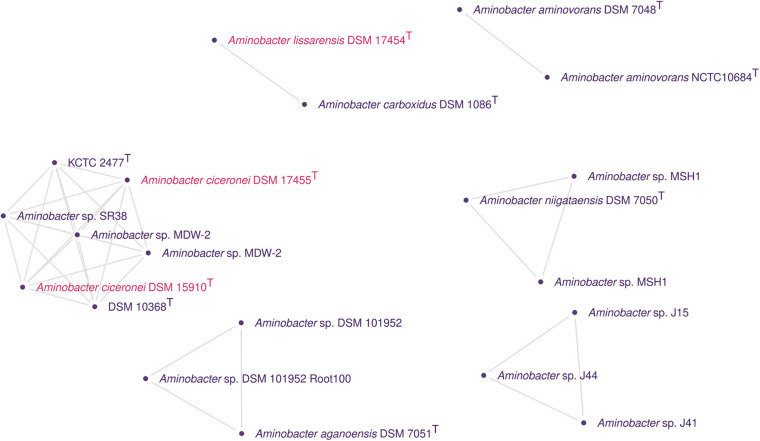
FIGURE 4.
Genomic clusters detected using pairwise ANI values from Aminobacter genomes. In the graph, the clusters have nodes corresponding to genomes and edges corresponding to ANI values above the cut-off for species delineation with a reliable alignment of between the genomes. Isolated nodes were removed. Different colors were used whenever possible to indicate different species names.

