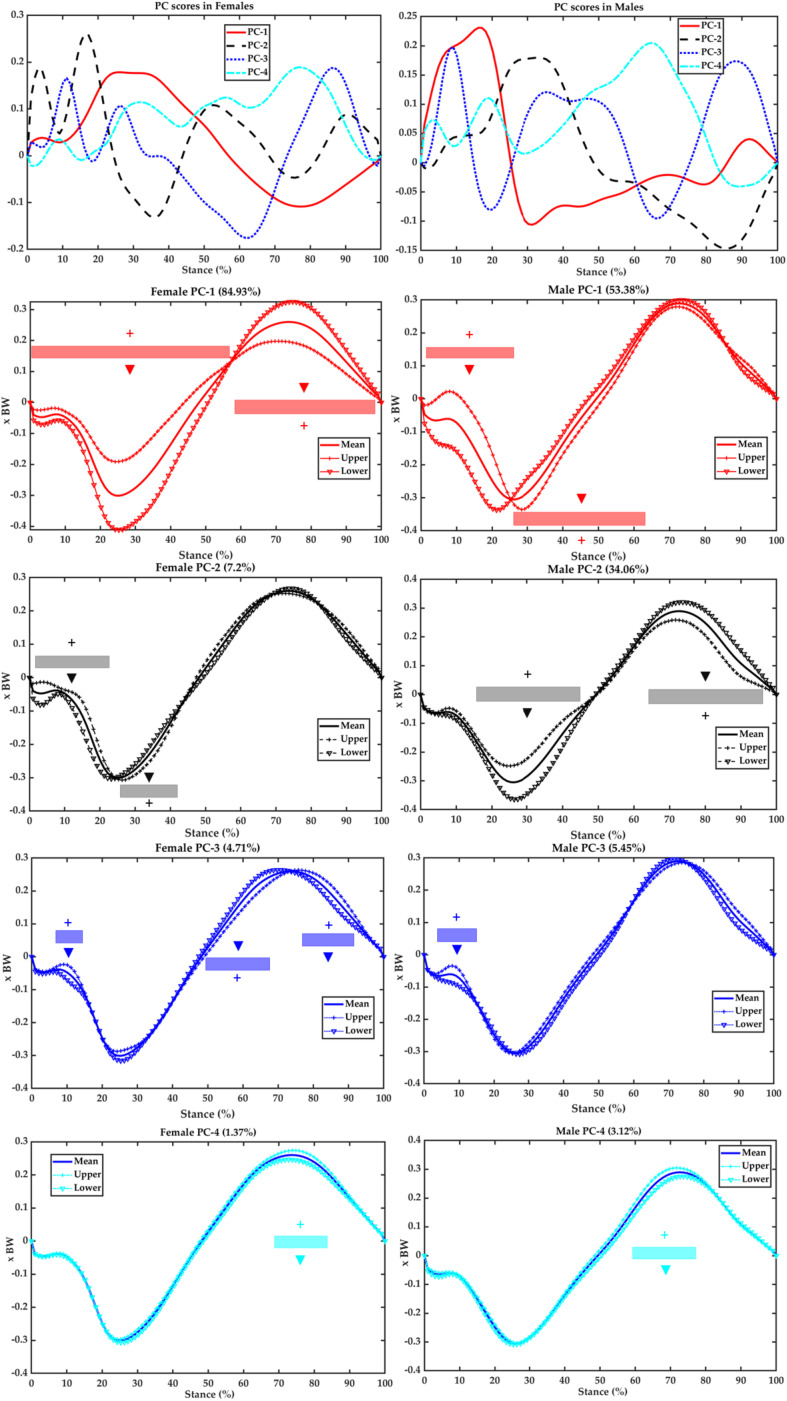
FIGURE 5.
Scores of the first four PCs (first row) and variances of PC1 (second row in red), PC2 (third row in black), PC3 (fourth row in blue), and PC4 (fifth row in cyan) against the mean ant–post GRF of the female (left) and male (right) runners. Upper (plus SD) limit (with symbol “+”) and lower (minus SD) limit (with symbol “▼”) highlight the contribution of plus/minus of the scores and coefficients for this PC.

