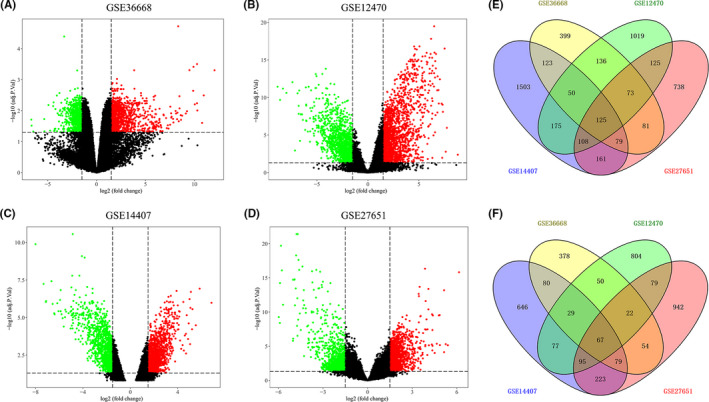
FIGURE 1.

Differential expression genes in four data sets from GEO. (A–D) The volcano plots visualize the DEGs in GSE36668, GSE12470, GSE14407, and GSE27651, respectively. The red dots represent upregulated genes and green represent downregulated genes; (E) Venn diagram for the intersection of upregulated genes; (F) Venn diagram for the intersection of downregulated genes
