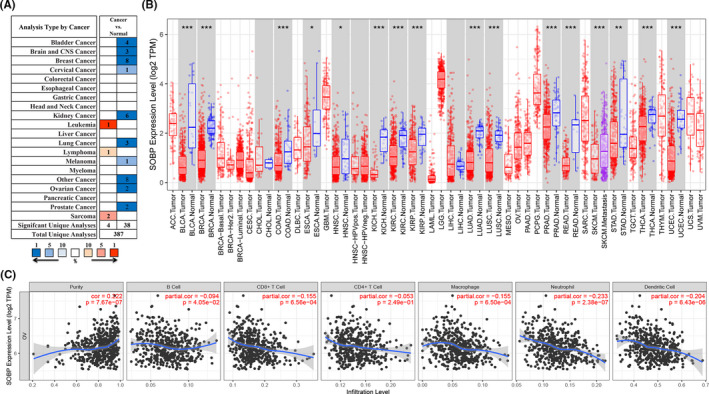
FIGURE 6.

The mRNA of SOBP in human cancer and related infiltration levels of immune cells in ovarian cancer. (A) SOBP expression in human tumors compared with normal tissues (Oncomine); (B) the SOBP expression in human cancers from TCGA samples (TIMER); *p‐value<0.05, **p<0.01, ***p<0.001; (C) correlation analysis of the SOBP expression and infiltration levels of immune cells in ovarian cancer (TIMER)
