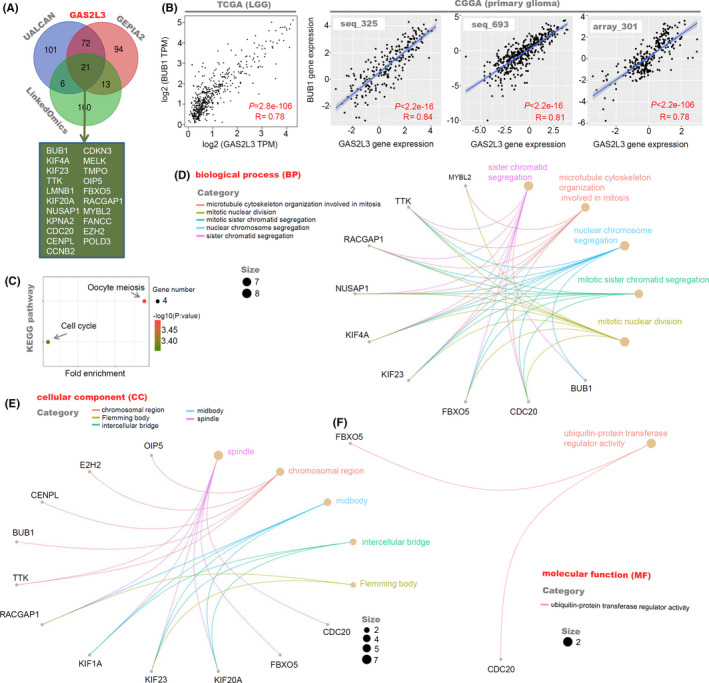
FIGURE 5.

GAS2L3‐correlated gene enrichment analysis in LGG patients. (A) We screened out three lists of the top 200 GAS2L3‐correlated genes, through UALCAN, GEPIA2, and LinkedOmics, and performed the intersection analysis by the Venn tool. (B) We utilized the “Correlation Analysis” function of GEPIA2 or CGGA to analyze the expression correlation between GAS2L3 and BUB1 gene. (C) KEGG pathway analysis was then performed by the DAVID tool and ggplot2 package. The (D) BP, (E) CC, (F) and MF data in GO analysis were also provided
