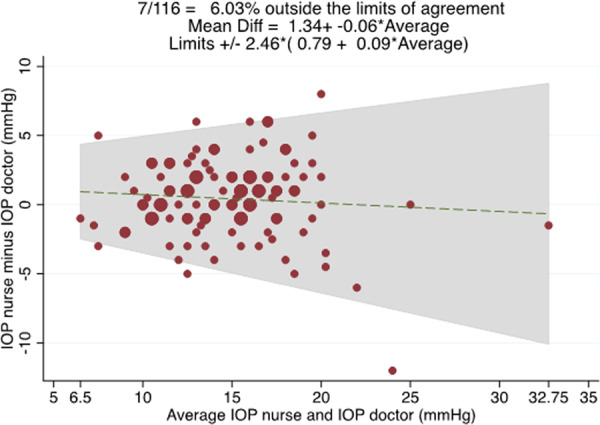
Fig. 1. Bland–Altman plot showing the relationship between the average of nurse and ophthalmologist IOP measurements (x axis) and the difference between the nurse and ophthalmologist measurements (y axis).

95% limits of agreement were +/– 2.46*(0.79+0.09*average GAT IOP measured by the ophthalmologist and nurse).
