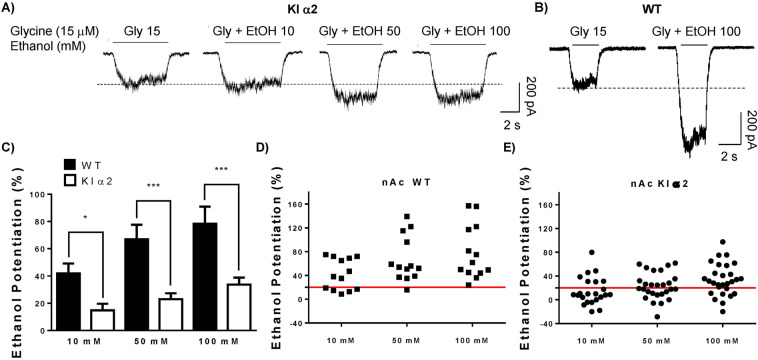
Fig. 1. Ethanol potentiation is reduced in neurons from nAc of KI α2 mice.
a Representative traces of evoked glycinergic currents with an EC10 of glycine (15 μM) in the presence of increasing concentrations of ethanol (10–100 mM) in nAc of KI α2 mice. b Representative traces of evoked glycinergic currents in the presence of 100 mM ethanol in nAc of WT mice. c Graph summarizes the percentage of potentiation of the glycinergic current for 10, 50 and 100 mM of ethanol in nAc from WT and KI α2 mice. d–e Scatter graph for the percentage of potentiation of the glycinergic current by ethanol in the WT and KI α2 mice, respectively. Higher potentiation is found in nAc of WT mice compared with KI α2. n = 28 for KI α2 and n = 13 for WT. Data are mean ± SEM, Two-way ANOVA and Bonferroni post hoc test, *p < 0.05, ***p < 0.001.

