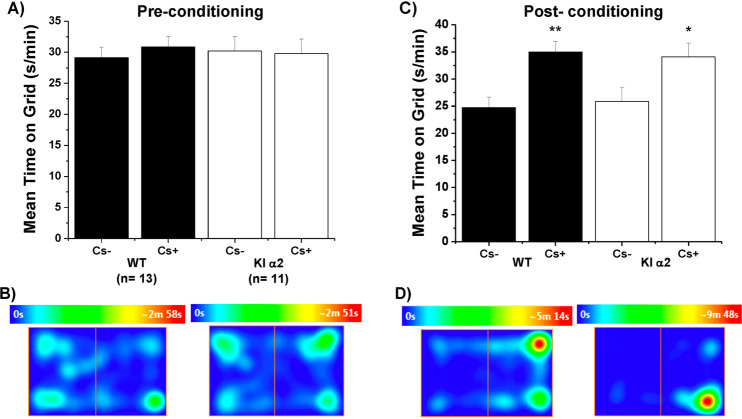
Fig. 5. Ethanol‐conditioned place preference in KI α2 and WT mice.
a The graph shows the time spent in the floor associated with ethanol injection (Cs+) and saline injection (Cs−) before the 8 sessions of conditioning of male WT and KI α2 mice. b Representative heat map of 15 min obtained from WT (left) and KI α2 (right) mice before the eight conditioning sessions. c The graph shows the time spent in the floor associated with ethanol injection (Cs+) and saline injection (Cs−) after the eight sessions of conditioning of WT and KI α2 mice. d Representative heat map of 15 min obtained from WT (left) and KI α2 (right) mice after the eight conditioning sessions. n = 11 KI α2 and n = 13 WT mice. Data represent mean ± SEM. Two-way ANOVA and Bonferroni post hoc test **p < 0.01; *p < 0.05.

