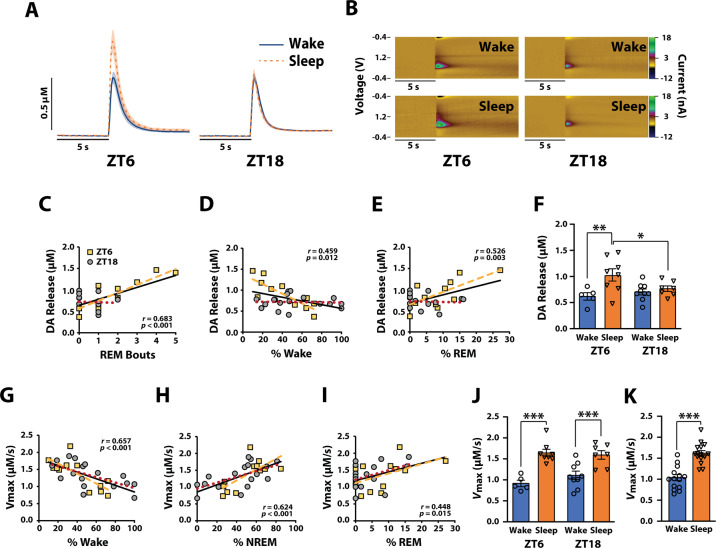
Fig. 2. Dopamine release and uptake fluctuate across sleep/wake state.
A Average current versus time plots and (B) example color plots for the Wake and Sleep groups during the light (ZT6) and dark (ZT18) phases. Shaded areas in current versus time plots represent SEM. Correlations between DA release and (C) REM bouts, (D) % of Wake, or (E) % of REM during the 30-min time period. F DA release for rats categorized into Wake and Sleep groups for ZT6 and ZT18 based on sleep/wake state during the 30 min time period. Correlations between DA uptake and (G) % of Wake, (H) % of NREM, or (I) % of REM during the 30 min time period. J DA uptake rate for rats categorized into Wake and Sleep groups for ZT6 and ZT18 based on sleep/wake state during the 30 min time period. K DA uptake rate for rats categorized into Wake and Sleep groups collapsed across ZT6 and ZT18. Wake (ZT6) n = 5 rats, Wake (ZT18) n = 9 rats, Sleep (ZT6) n = 8 rats, and Sleep (ZT18) n = 7 rats. Correlation coefficients associated p values, and black regression lines represent analyses on data collapsed across ZT6/ZT18. Yellow dashed lines depict regression lines for ZT6 data, and red dotted lines depict regression lines for ZT18 data. Note: data points in correlations appear different across panels due to overlaying of symbols. Data are shown as mean ± SEM. *p < 0.05; **p < 0.01; ***p < 0.001.

