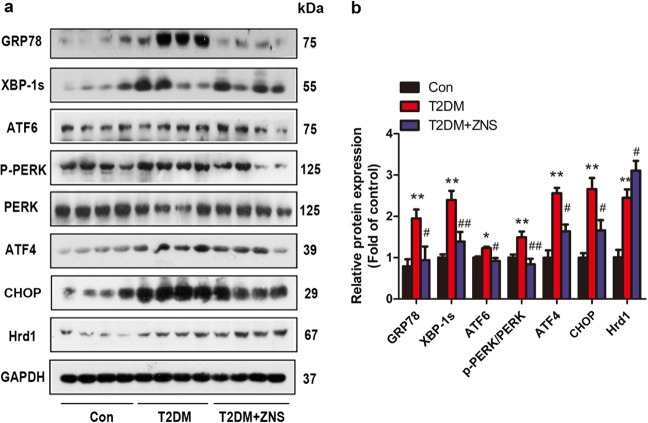
Fig. 7. Zonisamide suppresses ER stress in the hearts of type 2 diabetic mice.
a–b Representative and quantitative images showing the protein expression of ER stress markers, including GRP78, XBP-1s, ATF6, p-PERK, PERK, ATF4, CHOP, and Hrd1. All values are the fold changes normalized to their control group. The data are presented as the means ± SEM (n = 4–7). *P < 0.05, **P < 0.01 vs. Con; #P < 0.05, ##P < 0.01 vs. T2DM.

