Fig. 2.
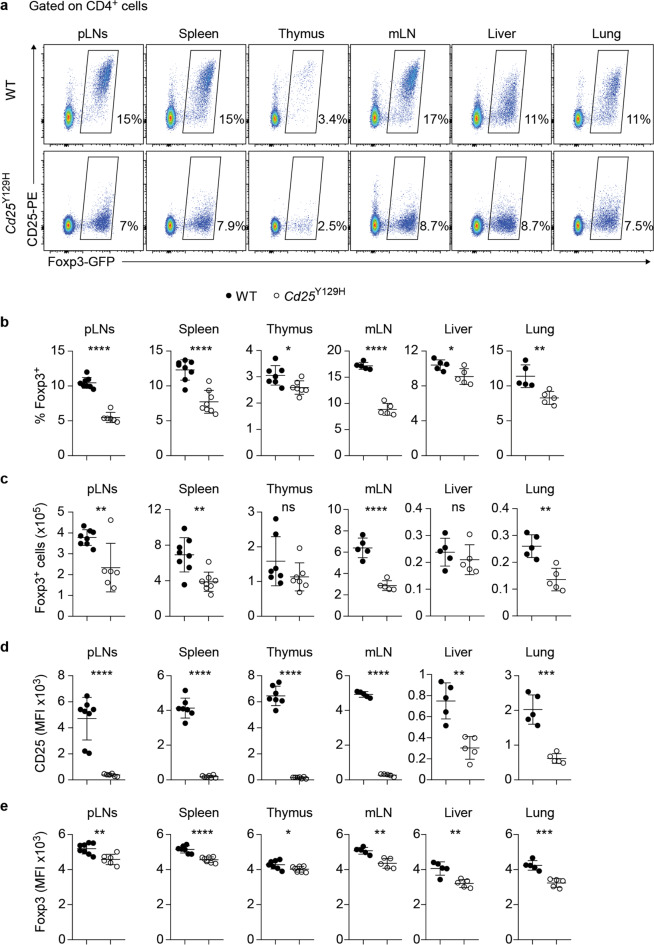
The hypomorphic Cd25Y129H mutation leads to reduced CD25 expression and loss of Foxp3+ Treg cells. a Representative FACS plots showing the expression of Foxp3 and CD25 by CD4+ T cells in the peripheral lymph nodes (pLNs), spleen, thymus, mesenteric lymph nodes (mLNs), liver, and lungs of 8–12-week-old WT and Cd25Y129H mice. b Percentages and c absolute cell numbers of Foxp3+ Treg cells in different organs of WT (filled circles) and Cd25Y129H (open circles) mice. Mean fluorescence intensities (MFIs) of CD25 (d) and Foxp3 (e) on Treg cells from WT and Cd25Y129H mice. Data were derived from at least three experiments with 5–8 mice per genotype and are represented as the mean ± SD. ns not significant; *p < 0.05, **p < 0.01, ***p < 0.001, ****p < 0.0001; two-tailed unpaired Student’s t test

