Fig. 4.
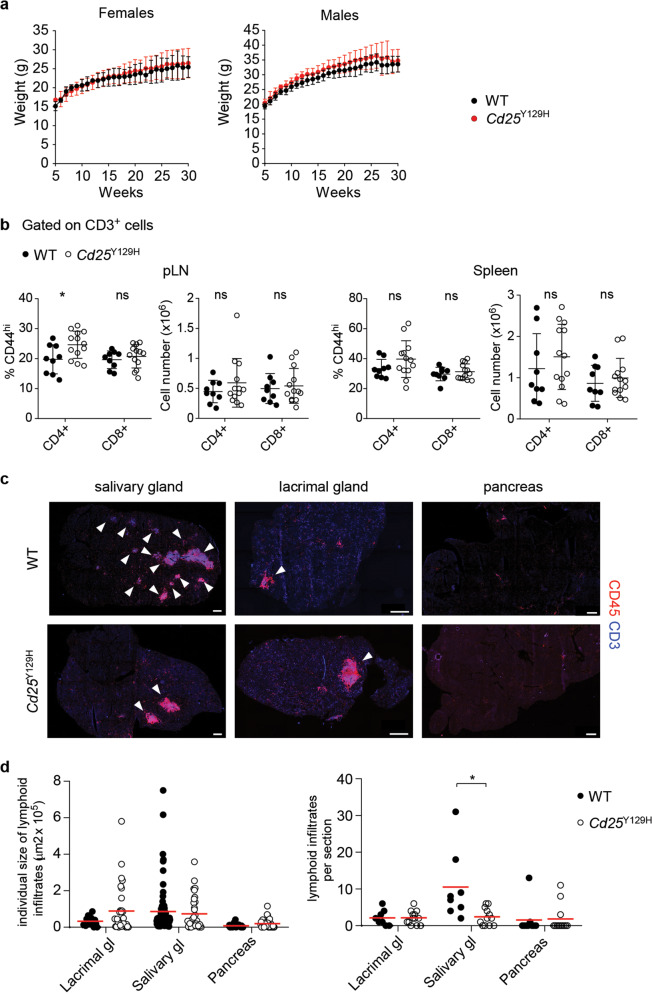
Lack of autoimmune symptoms in aged Cd25Y129H mice. a Weekly body weight monitoring of female (left) and male (right) WT (black line) and Cd25Y129H (red line) mice. Data were derived from 6 to 12 mice per genotype and sex. b Percentages and absolute cell numbers of CD44hi cells among CD4+ and CD8+ T cells from the pLNs (left) and spleen (right) of WT (filled circles) and Cd25Y129H (open circles) mice. Data were derived from at least three independent experiments with 9–13 mice per genotype. c Representative immunofluorescence microscopy of the salivary glands, lacrimal glands, and pancreas of WT (top) and Cd25Y129H mice (bottom) stained with the indicated antibodies. Scale bar, 500 μm. d Individual size (left) and number (right) of lymphoid infiltrates per section in the salivary glands, lacrimal glands, and pancreas of WT (filled circles) and Cd25Y129H (open circles) mice. Data were derived from at least three independent experiments with 9–13 mice per genotype. a–d Organs were isolated from 35- to 40-week-old mice. Data are shown as the mean ± SD. ns not significant; *p < 0.05 (two-tailed unpaired Student’s t test)

