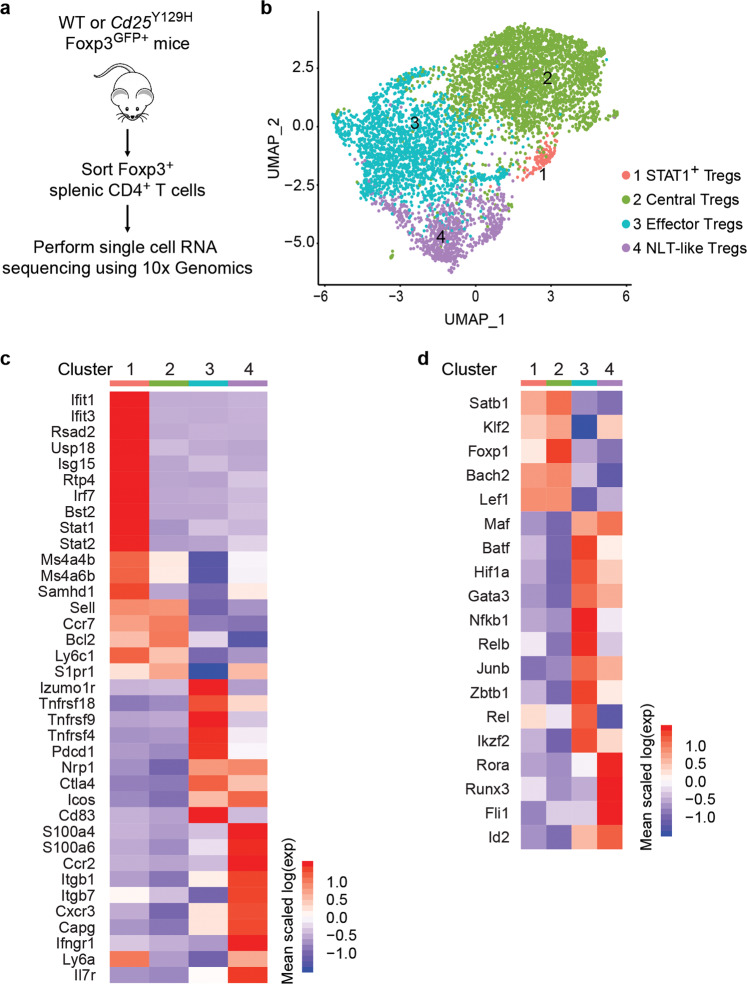
Fig. 5.
Identification of Treg cell subpopulations by single-cell RNA-seq analysis. a Experimental workflow for scRNA-seq analysis including sorting of splenic Foxp3GFP Treg cells from WT or Cd25Y129H mice and use of a Chromium Single Cell 3′ Reagent Kit. b UMAP-based clustering of merged scRNA-seq profiles of WT and Cd25Y129H Treg cells. Heatmap showing the expression of selected marker genes (c) and selected transcription factors (d) for each of the four clusters shown in b. A complete list of the genes and expression values is available in Supplementary Table 3

