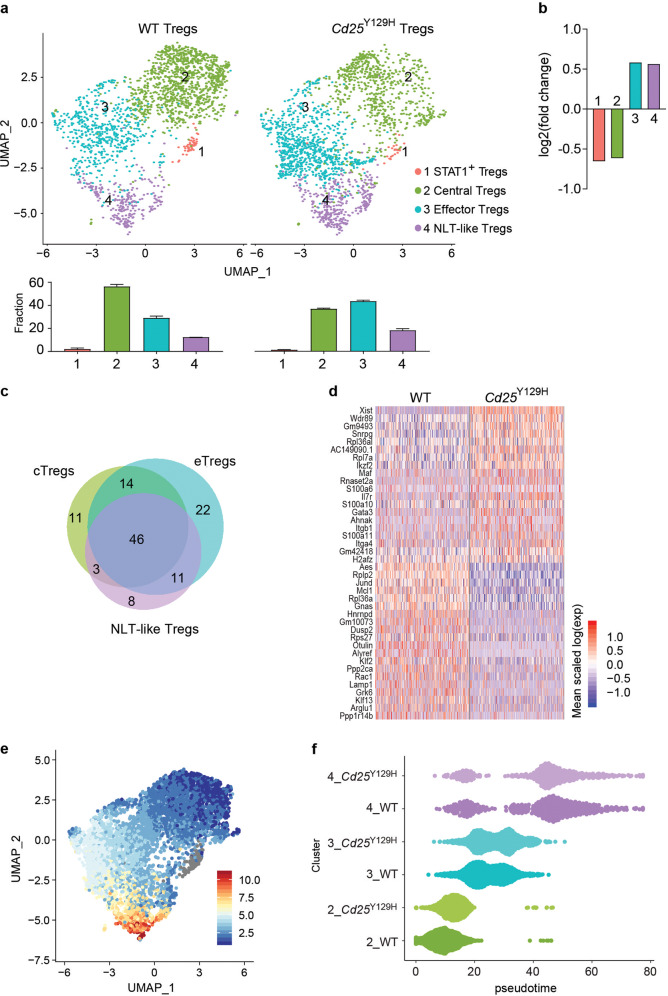
Fig. 6.
Comparison of WT and Cd25Y129H Treg cell subpopulations by single-cell RNA-seq. UMAP-based clustering (a) and quantitative analysis (b) of splenic Treg cells from WT and Cd25Y129H mice. Data were derived from 3 mice per group and are represented as log2 fold changes (see the “Materials and methods”). c Venn diagram showing the overlap among clusters 2, 3, and 4 for genes differentially expressed between WT and Cd25Y129H Treg cells. d Heatmap showing the top 20 differentially expressed genes in WT and Cd25Y129H Treg cells. A complete list of the genes and expression values is shown in Supplementary Table 5. e, f Trajectory inference analysis performed with Slingshot software

