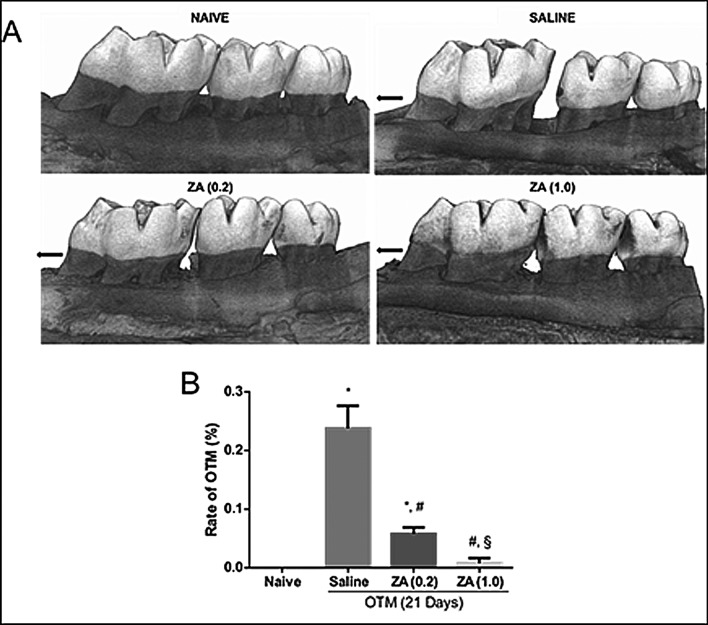
Figure 3.
Effect of zoledronic acid on OTM with 21 days of tooth displacement in the experimental groups. (A) Macroscopic analysis by computed microtomography. The black arrow indicates the direction of the force on the compression side. (B) Bars represent mean ± SEM of 6 animals per group. (*) indicates difference when compared to the naive group (#) indicates difference when compared to the saline group. (§) indicates difference when compared to the ZA group (0.2) (ANOVA p < 0.001, Levene p = 0.001 and Games—Howell pos-hoc test).

