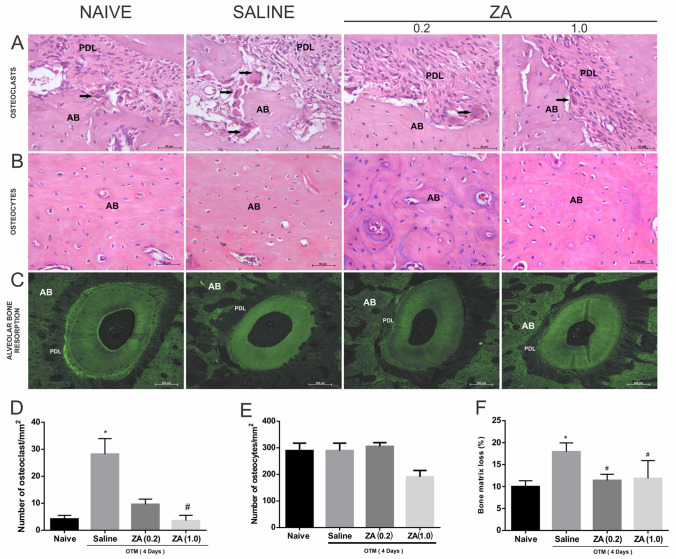
Figure 5.
Analysis of the effect of ZA on alveolar bone in the Naive, Saline, ZA (0.2) and ZA (1.0) experimental groups. (A) Osteoclastic cells in the bone matrix of the alveolar bone in the DV root. AB alveolar bone, PDL periodontal ligament. The black arrow indicates osteoclastic cells. (B) Osteocytes in the alveolar bone matrix. (A,B) The bars indicate 50 µm, HE staining, × 400 magnitude. (C) Histopathological analysis of the resorption of the alveolar bone on the compression side by confocal microscopy of the root DV, × 100 magnitude. (D) Number of osteoclastic cells in the alveolar bone. Bars represent mean ± SEM of 6 animals per group. (*) indicates difference when compared to the naive group, (#) indicates difference when compared to the saline group (Kuskal–Wallis test p = 0.001 and Dunn’s pos-hoc test). (E) Number of osteocyte cells in the alveolar bone. (F) Analysis of the levels of loss in the alveolar bone matrix. Bars represent mean ± SEM of 6 animals per group. (*) indicates difference when compared to the naive group. (#) indicates difference when compared to the saline group (ANOVA p = 0.019, Levene p = 0.103 and Tukey pos-hoc test).

