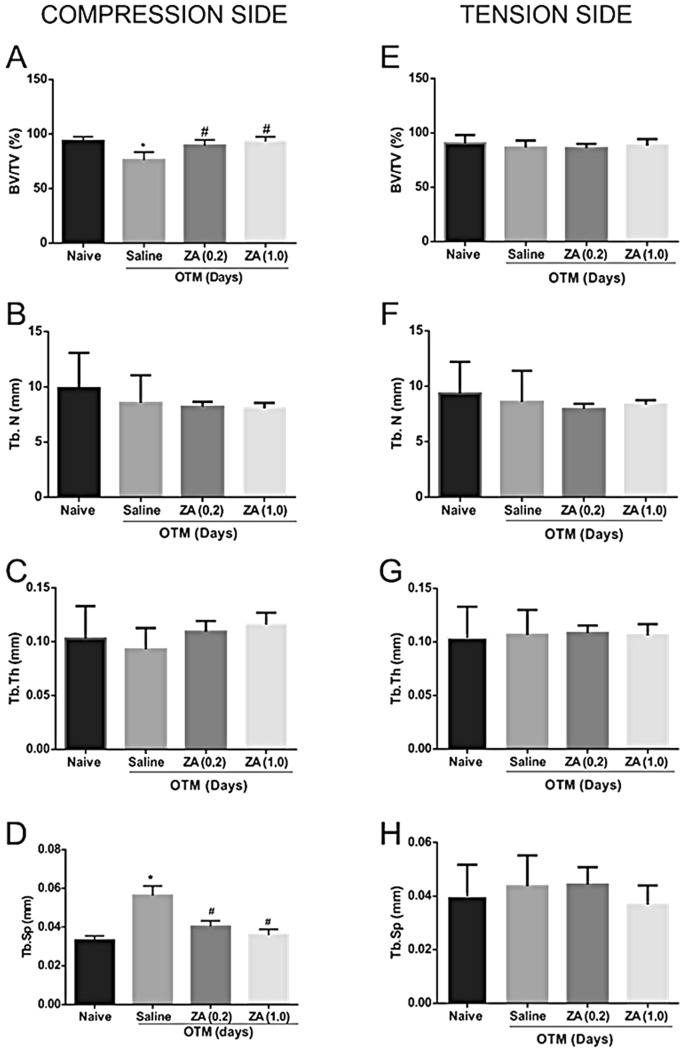
Figure 7.
Microarchitecture analysis of trabecular bone on the compression and tension side of the DV root in the Naive, Saline, ZA (0.2) and ZA (1.0) groups. Compression side (A) Analysis of the inorganic portion of the bone volume fraction / total jaw bone volume (*) indicates difference when compared to the naive group (#) indicates difference when compared to the saline group. (ANOVA p < 0.001, Levene p = 0.040, Games-Howell pos-hoc test). (B) Measures of density of number of trabeculae (Tb.N), (C) thickness (Tb.Th) and (D) separation between trabeculae (Tb.Sp), (*) indicates difference when compared to the naive group (#) indicates difference when compared to the saline group. (ANOVA p = 0.001, Levene p = 0.250, Tukey post-hoc test). Tension side (E) BV/TV fraction density measurements, (F) number of trabeculae (Tb.N), (G) thickness (Tb.Th) and (H) separation between the trabeculae (Tb.Sp).

