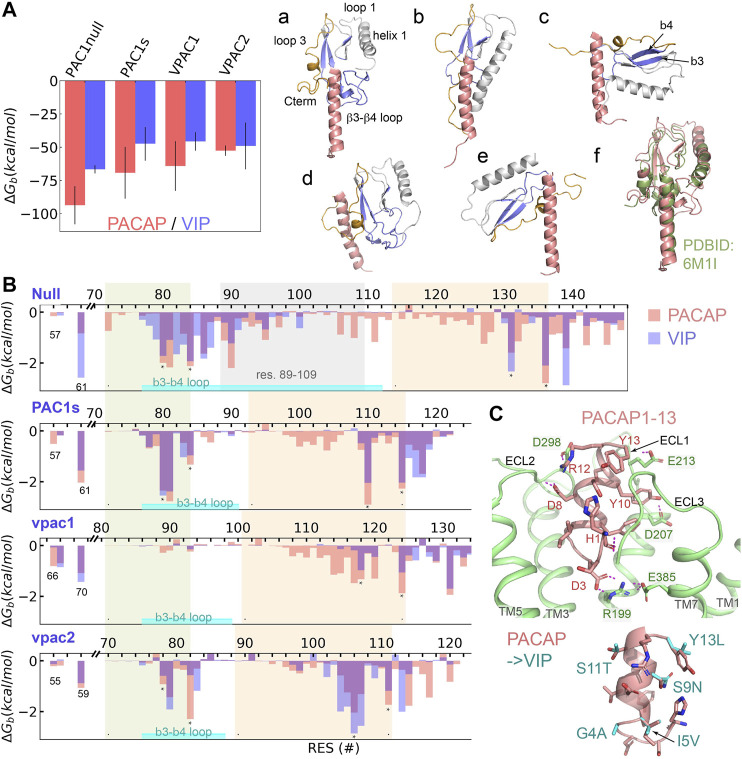
FIGURE 2.
Binding selectivity and recognition of PACAP and VIP on PAC1null, PAC1s, VPAC1 and VPAC2 receptors. (A) Binding free energy (ΔGb) of PACAP and VIP on PAC1null, PAC1s, VPAC1 and VPAC2 receptors respectively by averaging the ΔGb values from five replicas with bars representing the standard deviation. Representative binding conformations are displayed on the right, where residues to calculate free energy decomposition in (B) are colored in blue; only residues 1–27 are displayed for PACAP and VIP. (B) ECD per-residue free energy decomposition (average of five replicas) in PAC1 and VPAC1/2 binding PACAP (red column) and VIP (blue column). β3–β4 including the loop between is labeled. The 21 amino acids (residues 89–109) are labeled in PAC1null. (C) Close view of the N-terminal residues 1–13 of PACAP interacting with transmembrane orthosteric pocket of PAC1 receptor. Hydrogen bonds are shown in dashed lines. Comparison of PACAP with VIP at residues 1–13 by direct mutations is shown at the bottom right.

