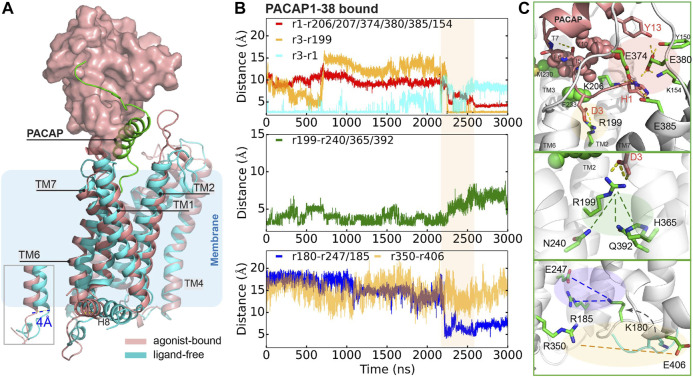
FIGURE 3.
Representative conformation of PACAP-activated PAC1null receptor. (A) Structural alignment of PACAP-activated (red) and ligand-free (cyan) conformations. Ligand-free conformation is from our recent study(Liao et al., 2017) with only the 7TM shown. PACAP is shown in green cartoon and ECD is shown in surface representation. (B) Time evolution of average distance or pair distance of key charged/polar residues locating at the extracellular side, middle transmembrane, and intracellular side of the PAC1null receptor, which are displayed in (C) accordingly. Adaptive tempering period is in light orange strip background.

