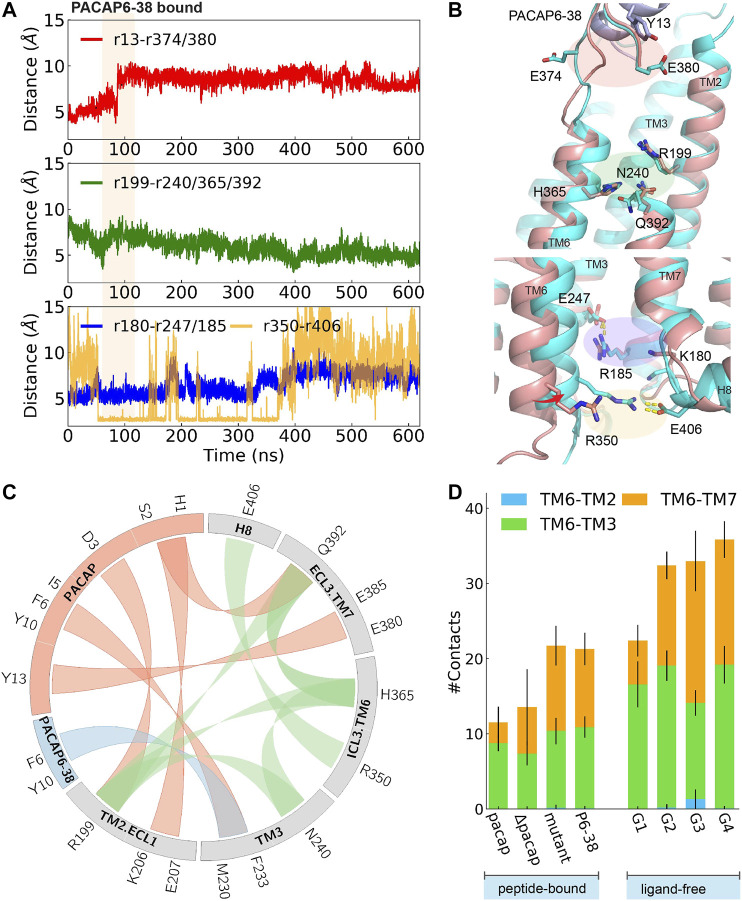
FIGURE 4.
Time evolution of average distance or pair distance of key charged/polar residues locating at extracellular side, middle transmembrane, and intracellular side of PAC1null binding PACAP6-38, which are illustrated in (B) accordingly. Adaptive tempering period is in light orange strip background. (B) Final snapshot of PACAP6-38 bound PAC1null (cyan) superposed on PACAP-activated PAC1null structure (red), in which an inward shifting of TM6 was observed. (C) Wheel plot of major polar and hydrophobic interactions in the N-terminus of PACAP bound PAC1null (in red), N-terminus of PACAP6-38 bound PAC1null (in blue), and residue interactions within ligand-free PAC1null (in green). (D) Stack histogram of number of contacts between the intracellular half of TM6 (residues 344–360) and TM2, TM3, and TM7 in PAC1null receptor with: PACAP, PACAP deleted (ΔPACAP), PACAP6-38 (P6-38), and PACAP mutant (G4A, I5V, S9N, S11T, Y13L). Collections of the last 120 ns of each replica were used for the contact calculations for the PACAP, ΔPACAP, P6-38, and PACAP mutant systems. G1-G4 represent the four major ligand-free conformational states in Figure 1B. We used the last 960 ns of each 2- μs ligand-free system (Liao et al., 2017) for the contact calculations.

