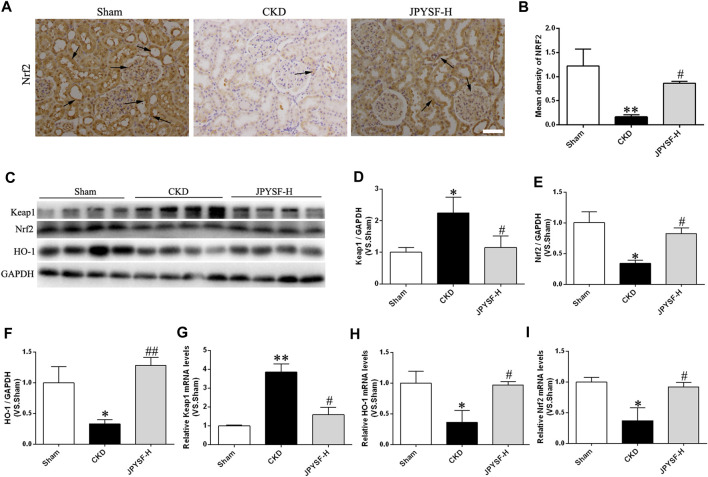
FIGURE 6.
JPYS formula activates the Nrf2 signaling in the kidneys from CKD rats. (A) IHC staining of Nrf2 in the kidney (×200, scale bar = 100 μm). (B) Quantification ofNrf2 density. Nrf2-positive areas are indicated by arrows. (C) Representative western blots for Keap1, Nrf2, HO-1, and GAPDH protein expression in kidney tissue. (D) Quantitative analysis of Keap1/GAPDH. (E) Quantitative analysis of Nrf2/GAPDH. (F) Quantitative analysis of HO-1/GAPDH. Relative mRNA expression levels of Keap1 (G), HO-1 (H), and Nrf2 (I). All data are expressed as means ± SEM. *p < 0.05, **p < 0.01 vs. the sham group; #p < 0.05, ##p < 0.05 vs. CKD group.

