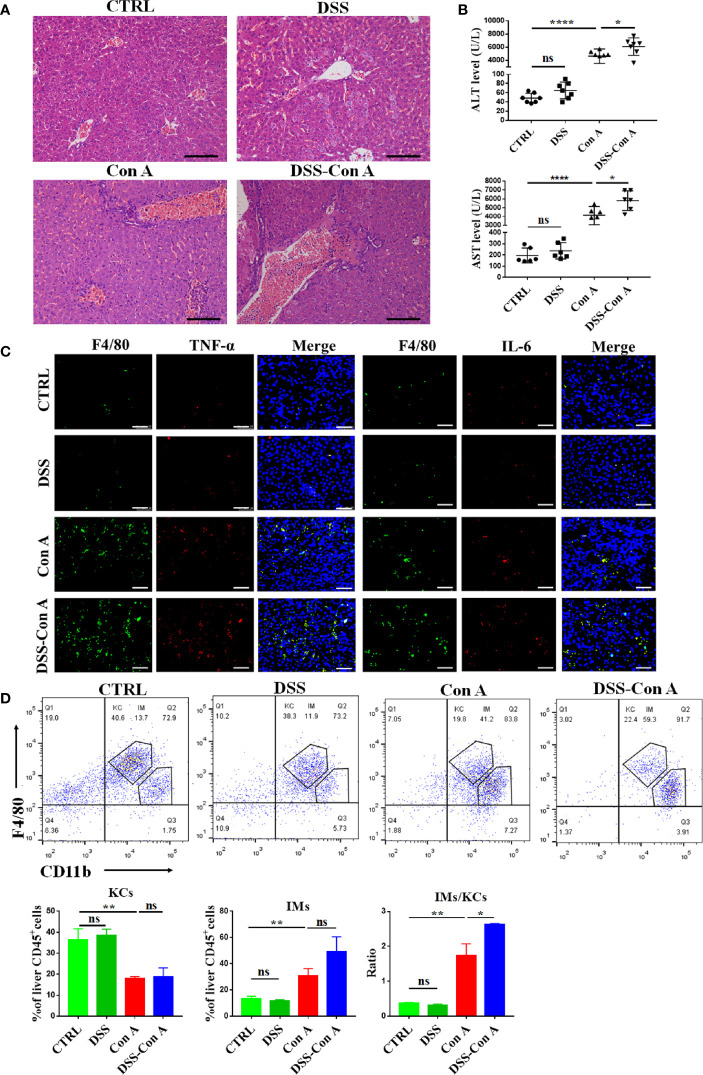
Figure 4.
Breakage of the intestinal barrier aggravated liver injury and infiltration of liver macrophages. (A) HE staining of liver tissues in four groups. (B) The plasma concentrations of ALT and AST in four groups. (C) Double-immunofluorescence staining for F4/80 and TNF-α, F4/80 and IL-6 of liver tissues in four groups. (D) Representative flow cytometry plots and percentage of CD45+F4/80hiCD11blo Kupffer cells and CD45+F4/80loCD11bhi infiltrating macrophages in mononuclear cells from liver of the four groups. (n=6). Scale bars: 50μm. The data were presented as means ± SD (Student’s t-test, *p < 0.05, **p < 0.01, ****p < 0.0001, ns: p < 0.05).

