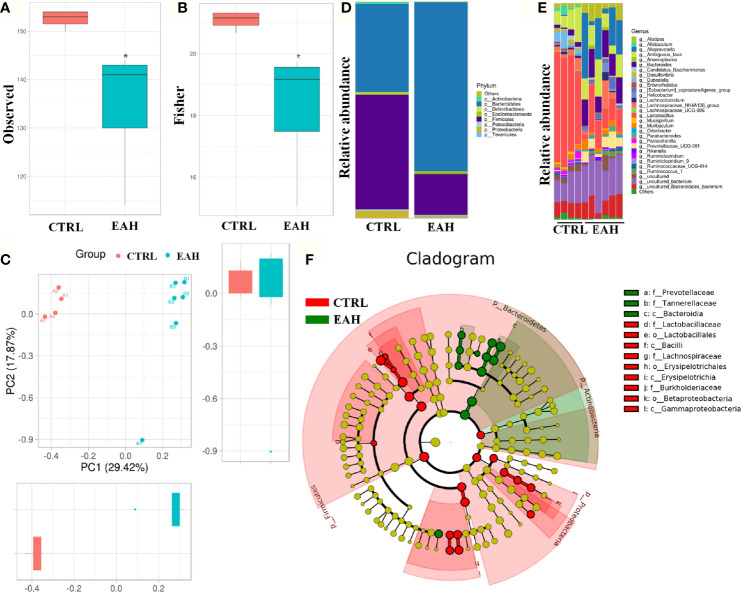
Figure 7.
Alteration of the gut microbiota composition in EAH mice. (A, B) Observed (A) and Fisher (B) diversity indexes of the gut microbiota in CTRL group (n=4) and EAH group (n=6). (C) ANOSIM based on weighted UniFrac distances. (D) Bar charts of the gut microbiota composition at the phylum level in CTRL group and EAH group. (E) Bar charts of the gut microbiota composition at the genus level in each mouse. (F) Cladogram generated from the LEfSe. (*p < 0.05).

