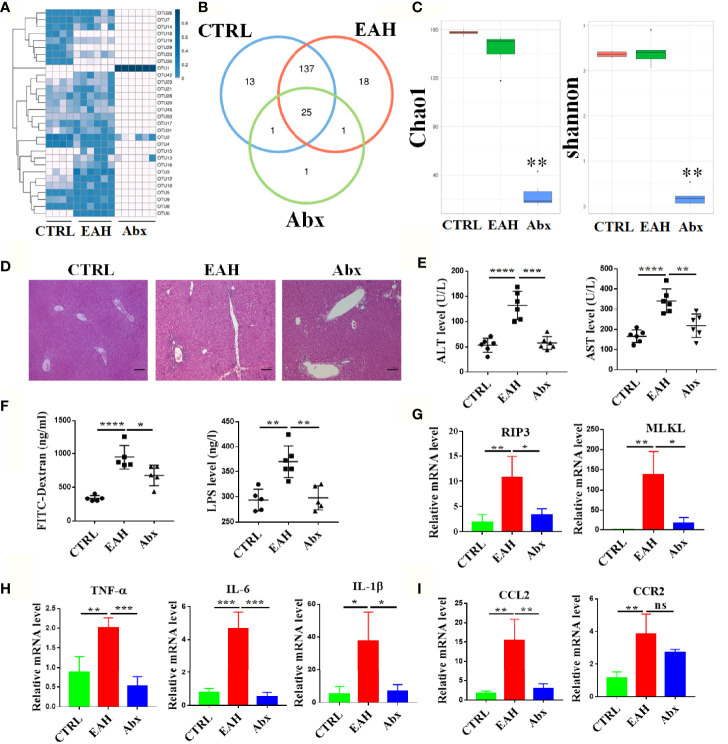
Figure 8.
RIP3-mediated activation and infiltration of liver macrophages requires gut commensal microbiota. (A, B) Bacterial OUT heatmap (A) and Venn diagrams (B) in the CTRL group (n=4), EAH group (n=6) and Abx group (n=6). (C) The community richness and diversity of the gut microbiota were evaluated with Chao1 and Shannon indexes. (D) HE staining of the liver tissue from three groups. (E) The plasma concentrations of ALT and AST of three groups. (F)The plasma concentrations of FITC-D and LPS of three groups. (G–I) RT-qPCR analysis of RIP3 and MLKL (G) TNF-α, IL-6, and IL-1β (H) CCL2 and CCR2 (I) in three groups. Scale bars: 100μm. The data were presented as means ± SD (Student’s t-test, *p < 0.05, **p < 0.01, ***p < 0.001, ****p < 0.0001, ns: p > 0.05).

