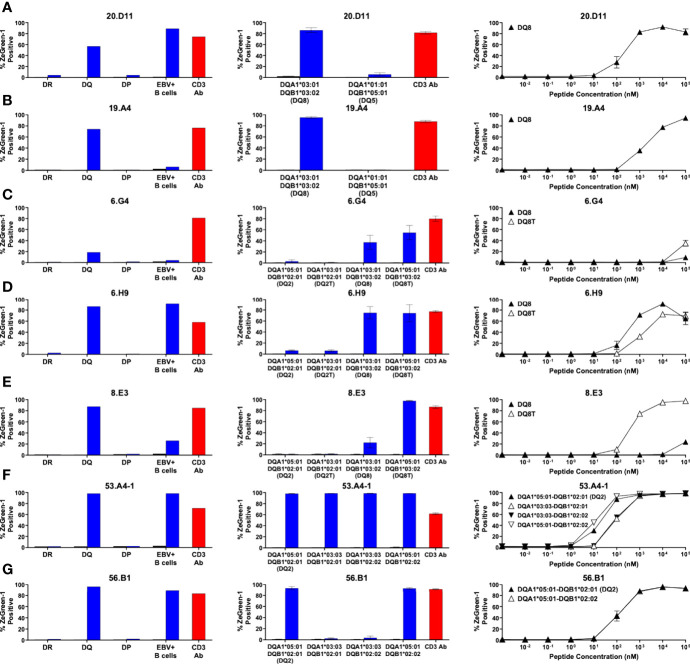
Figure 4.
Preproinsulin-reactive TCR clonotypes restricted by HLA-DQ. TCR transductants, (A) 20.D11, (B) 19.A4, (C) 6.G4, (D) 6.H9, (E) 8.E3, (F) 53.A4-1, (G) 56.B1, were cultured with cognate peptides in the presence of designated antigen presenting cells, followed by assessment of ZsGreen-1 expression by flow cytometry. Left panels: TCR transductants were cultured with (blue bars) or without (black bars) cognate peptides in the presence of autologous EBV-transformed B cells generated from spleen cells of (A, B) nPOD 6342, (C–E) nPOD 6323, or (F, G) nPOD 6414, or K562 cells transduced with DR, DQ, or DP alleles based upon their HLA genotype in Table 1 . Culture wells containing an anti-CD3 monoclonal antibody were included as a positive control (red bars). Center panels: TCR transductants were cultured with (blue bars) or without (black bars) cognate peptides in the presence of K562 cells transduced with individual DQ alleles based upon their HLA genotype in Table 1 . Right panels: TCR transductants were cultured with different concentrations of cognate peptides in the presence of K562 cells transduced with (A, B) DQA1*03:01 and DQB1*03:02; (C–E) DQA1*03:01 and DQB1*03:02 (black triangles), or DQA1*05:01 and DQB1*03:02 (white triangles); (F) DQA1*05:01 and DQB1*02:01 (black triangles), DQA1*03:03 and DQB1*02:01 (white triangles), DQA1*03:03 and DQB1*02:02 (black inverted triangles), or DQA1*05:01 and DQB1*02:02 (white inverted triangles); (G) DQA1*05:01 and DQB1*02:01 (black triangles), or DQA1*05:01 and DQB1*02:02 (white triangles). Experiments in left panels were performed once. All remaining experiments in center and right panels were independently repeated three times, and mean values ± standard error of the mean are shown.

