Figure 7.
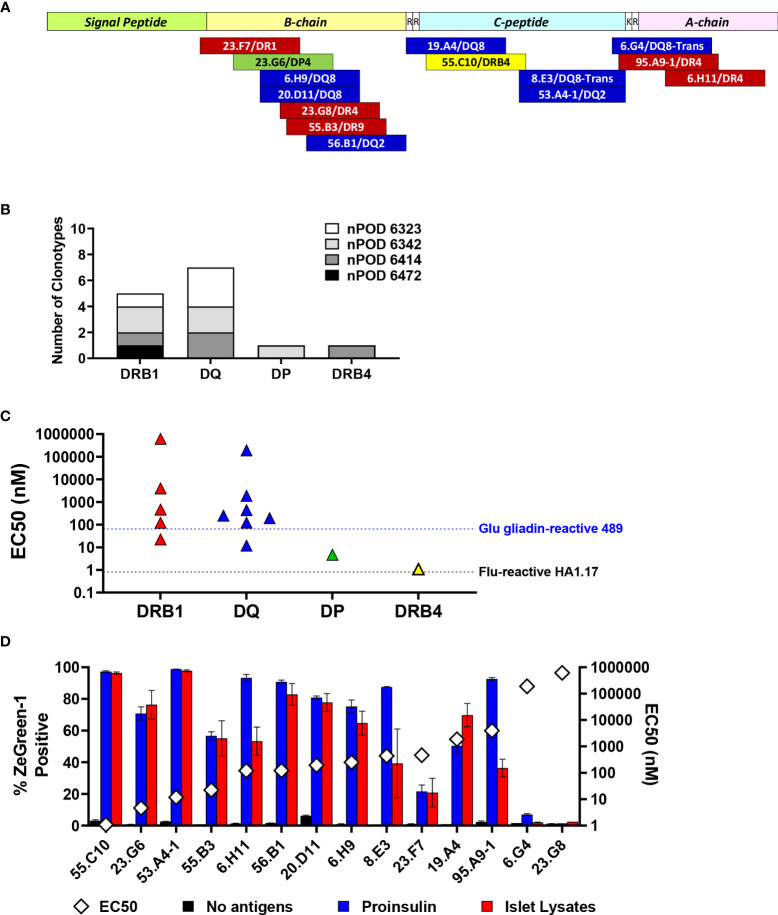
Characteristics of proinsulin-specific TCR clonotypes. (A) Location of epitopes in preproinsulin and restricting HLA molecules are mapped. Red, blue, green, and yellow bars represent epitopes for TCR clonotypes restricted by HLA-DRB1, DQ, DP, and DRB4. (B) Numbers of preproinsulin-reactive TCR clonotypes restricted by HLA-DRB1, DQ, DP, and DRB4. Preproinsulin-reactive TCR clonotypes derived from individual nPOD donors are shown separately by HLA restriction. (C) EC50 values of responses by preproinsulin-reactive TCR clonotypes are shown separately by HLA restriction. EC50 values of responses by HA.1.17 to the cognate influenza peptide (black line) and 489 to the deamidated alpha-gliadin peptide (blue line) are included for reference. (D) Responses to proinsulin and human islet lysates by TCR transductants reactive to proinsulin peptides. TCR transductants were cultured with K562 cells expressing cognate HLA molecules pulsed with proinsulin (blue bars) or islet lysates (red bars), or without antigens (black bars). After overnight culture, ZsGreen-1 expression was evaluated by flow cytometry. Experiments were independently repeated twice, and mean values ± standard error of the mean are shown. EC50 values of responses to cognate peptides (white diamond symbols) are included for reference.

