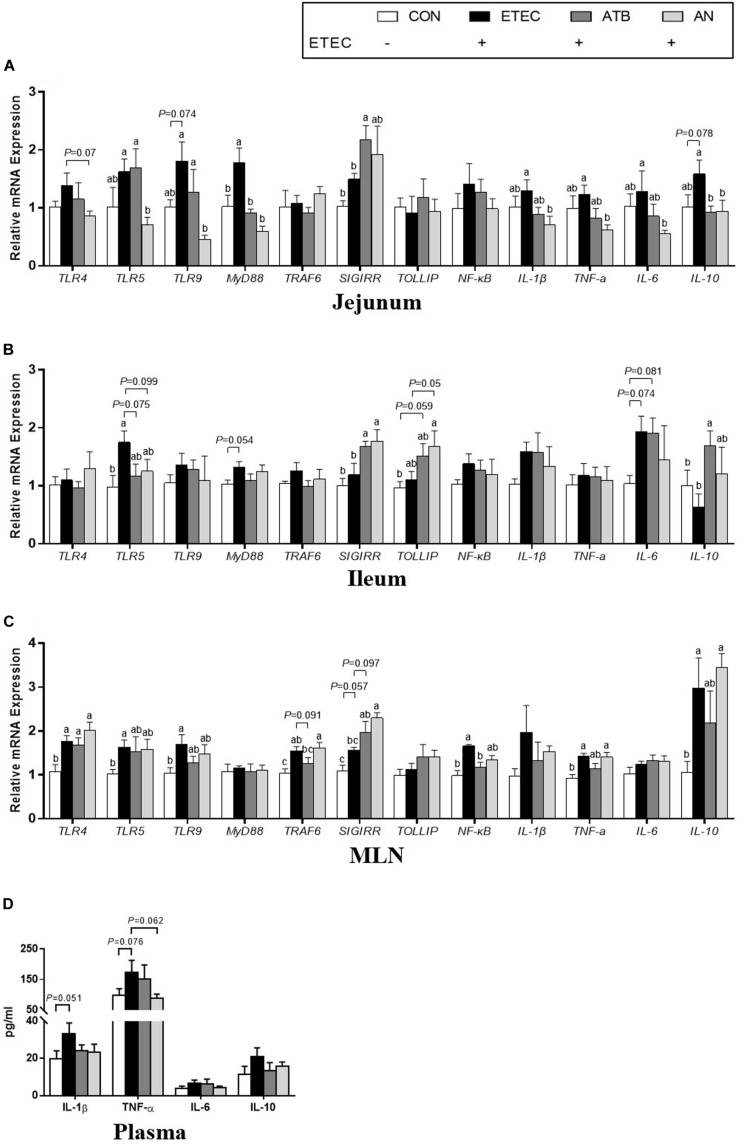
FIGURE 3.
Effects of anethole on concentration of relative mRNA expression of genes related to inflammation (A) jejunum, (B) ileum, (C) MLN, and (D) plasma cytokine and of piglets challenged with enterotoxigenic Escherichia coli K88. ELISA for plasma, n = 9; For PCR assays, n = 8, GAPDH as reference gene; The data in each group is expressed as the mean ± SE. Different letters mean statistically significant difference among the groups (P < 0.05).

