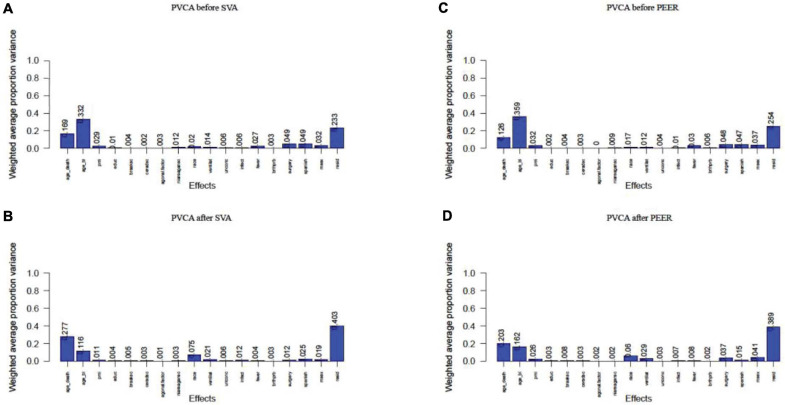
FIGURE 9.
PVCA plot of correlation before and after correction of unknown variables. (A) PVCA plot before the correction of surrogate variables; (B) PVCA plot after the correction of surrogate variables; (C) PVCA plot before the correction of hidden factors; (D) PVCA plot after the correction of hidden factors.

