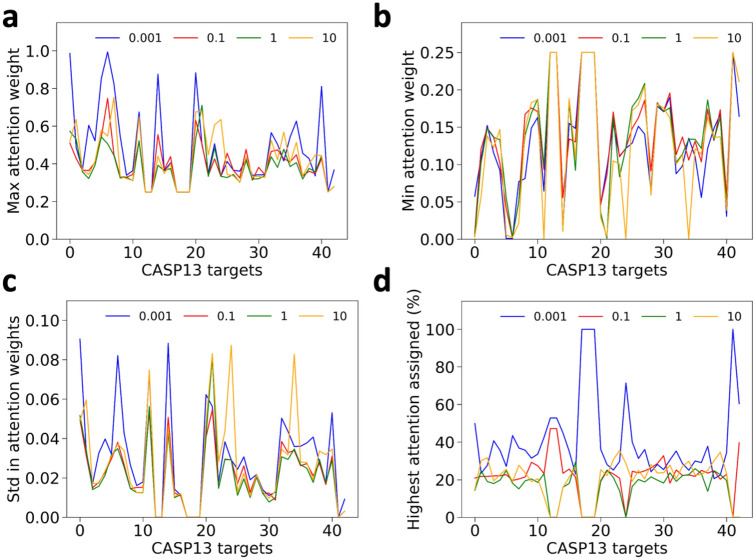
Figure 6.
Statistics of pairwise attention weights given to the 43 CASP13 targets. (a) the maximum attention weight given to each MSA among values for all the residue pairs. (b) the minimum attention weight given to each MSA. c, standard deviation given to each MSA. (d) Percentage of residue pairs in a target where each MSA had the largest attention weight. In all figures the x-axis represents the 43 CASP13 targets. Four MSAs with E-value of 0.001, 0.1, 1, and 10 are shown in blue, red, green, and yellow lines.

