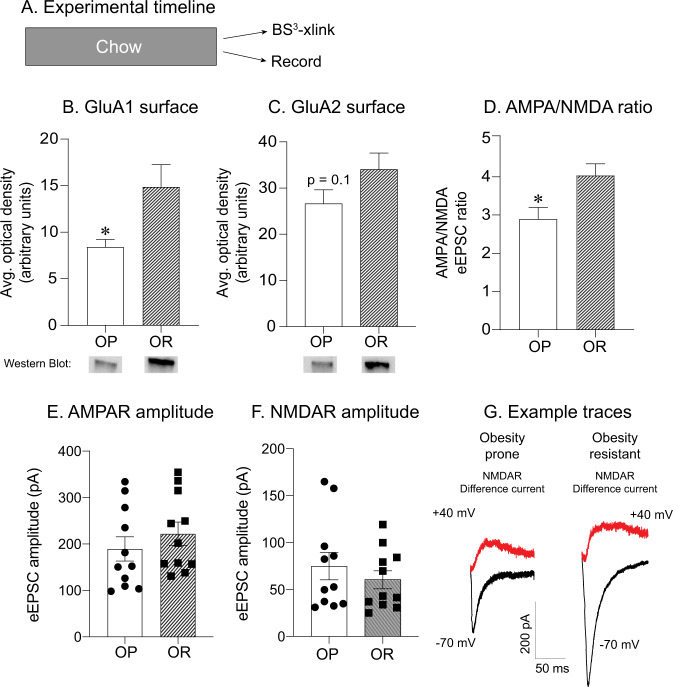
Fig. 4. Basal differences in GluA1 surface expression and AMPA/NMDA ratio in obesity-prone vs. obesity-resistant male rats.
a Experimental timeline. b Average GluA1 surface expression in chow fed obesity-prone (OP) and obesity-resistant (OR) male rats. Obesity-prone rats have lower GluA1 surface expression in the NAc compared with obesity-resistant rats. c Average GluA2 surface expression in chow fed obesity-prone and obesity-resistant male rats. GluA2 surface expression was similar between obesity-prone and obesity-resistant groups. d Average AMPA/NMDA ratio was smaller in obesity-prone vs. obesity-resistant male rats. e AMPAR amplitude was similar between obesity-prone and obesity-resistant male rats. f NMDAR amplitude was similar between obesity-prone and obesity-resistant male rats. g Representative traces of AMPAR-mediated (black) and NMDAR-mediated (red) currents. *p < 0.05 OP vs. OR.

