
Fig. 2. Spatial interpolates of the admixture coefficients estimated with STRUCTURE for K = 3.
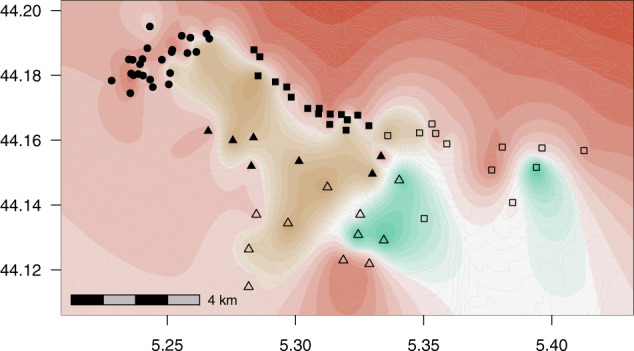
The colours red coral, ochre and aquamarine correspond, respectively, to clusters C1, C2 and C3. The colour intensity indicates the probability to belong to the dominant cluster at a given position in space, based on spatial kriging of the individual q-matrix (see Fig S4 for additional information). Plots shape indicates the region (see legend of Fig. 1). Grey lines represent topographic isoclines.