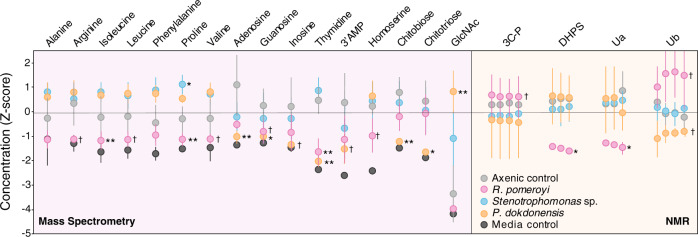
Fig. 3. Bacterial drawdown of diatom exometabolites compared to axenic diatom cultures based on analysis of spent media by targeted LC-ESI-MS (left) and 13C-HSQC NMR (right).
Data are Z scores of adjusted concentration (MS analysis) and scaled area (NMR analysis). Grouped data points indicate linked carbon atoms in NMR analysis. See Fig. S1 for time course of MS data and Fig. S2 for contour plots of NMR features. n = 3–7. ** = treatments significantly different from the axenic diatom cultures at adjusted p ≤ 0.01; * = treatments different from the axenic diatom cultures at p ≤ 0.05; † = treatments different from the axenic diatom cultures at p < 0.10.

