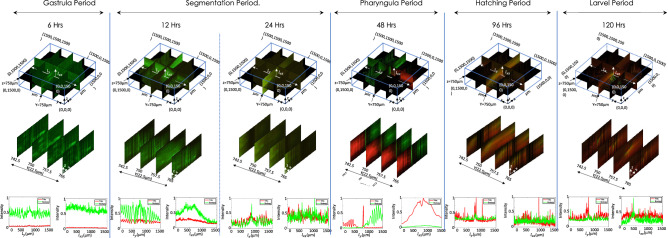
Figure 6.
Zebrafish development at various phases indicating a cross-over from lipid-to-protein dependent metabolism. Intensity plot at 6 h period shows BODIPY dominating over TRITC indicating that muscle is yet not developed. At 12 h, there is a rise in TRITC level but dominated by BODIPY, whereas at 24 h significant amount of BODIPY and increased level of TRITC indicates growth of muscles. 48 h volume data shows significant amount of TRITC indicating developed muscles and localised yolk-sac (labeled by BODIPY). Finally, at 96 h and 120 h, BODIPY is localised and distributed over the prominent muscles.

