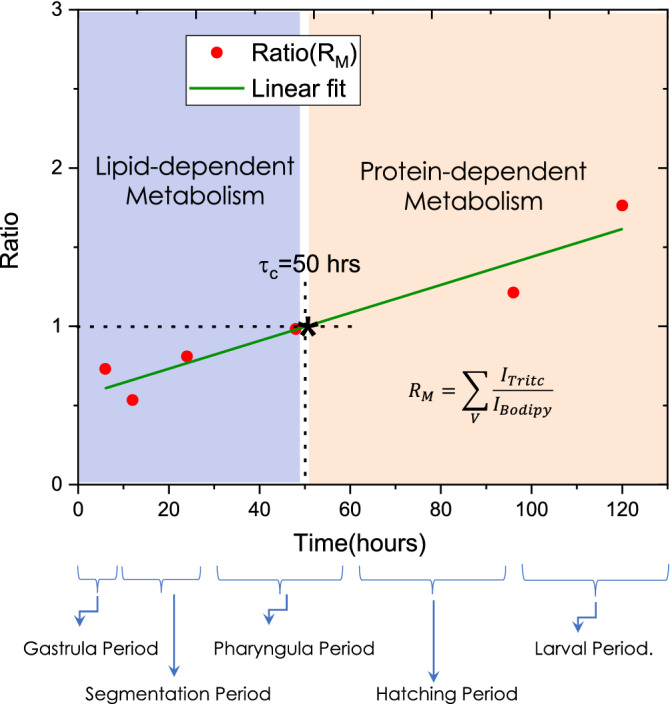
Figure 7.

Mean ratio plot for determining the transition from lipid based metabolism to protein based metabolism. The data points are obtained by integrating the ratio of TRITC and BODIPY (representing, muscle and yolk-sac respectively in Zebrafish). A linear fit is used to represent the data. The region to the left of the critical transition time () is labeled as lipid-based metabolism and the region to the right of as protein-based metabolism. The critical transition time occurs in the Pharyngula period (approximately at 50 h after fertilization).
