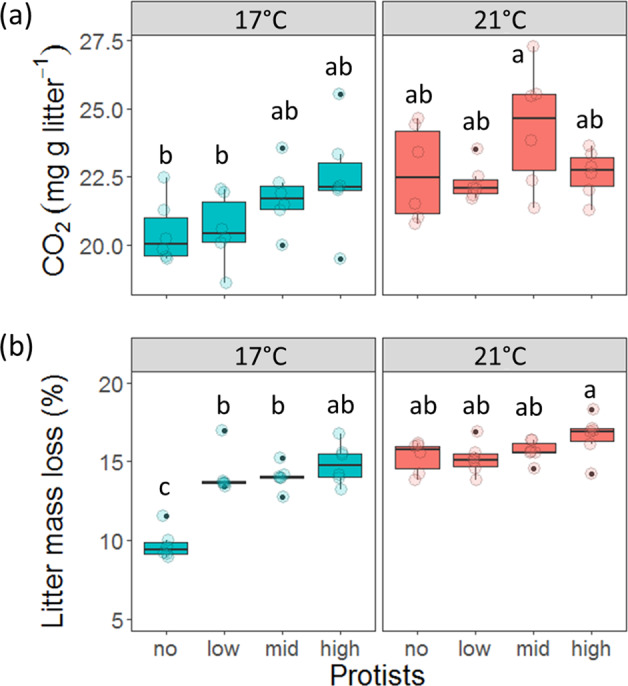
Fig. 1. Changes in microbial CO2 production and litter decomposition rates as induced by protist predators.

Boxplots showing (a) cumulative CO2 respiration (measured from the addition of protists until the end of the experiment) and (b) litter mass loss for microcosms with no protists or low, medium (mid) or high concentrations of protists (x-axis) at 17° and 21 °C. Different letters above the boxes indicate significant differences (p < 0.05) between treatments, as was indicated in a Tukey HSD posthoc test. Tukey tests were carried out across the protists × temperature interactions, so letters can be compared across facets.
