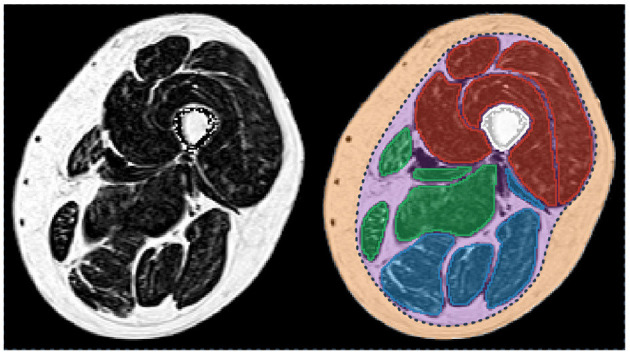
Figure 1.

Fat fraction map of a thigh of a patient with myotonic dystrophy type 1 (left) and corresponding segmentation of the principal regions of interest (right). Femur is in white. The individual muscles of the knee extensors, knee flexors, and the medial compartment are in red, blue, and green, respectively. Subcutaneous (orange) and perimuscular (purple) tissues are separated by the fascia lata (dot line in dark blue). Patient participated in the randomized controlled trial OPTIMISTIC (5).
