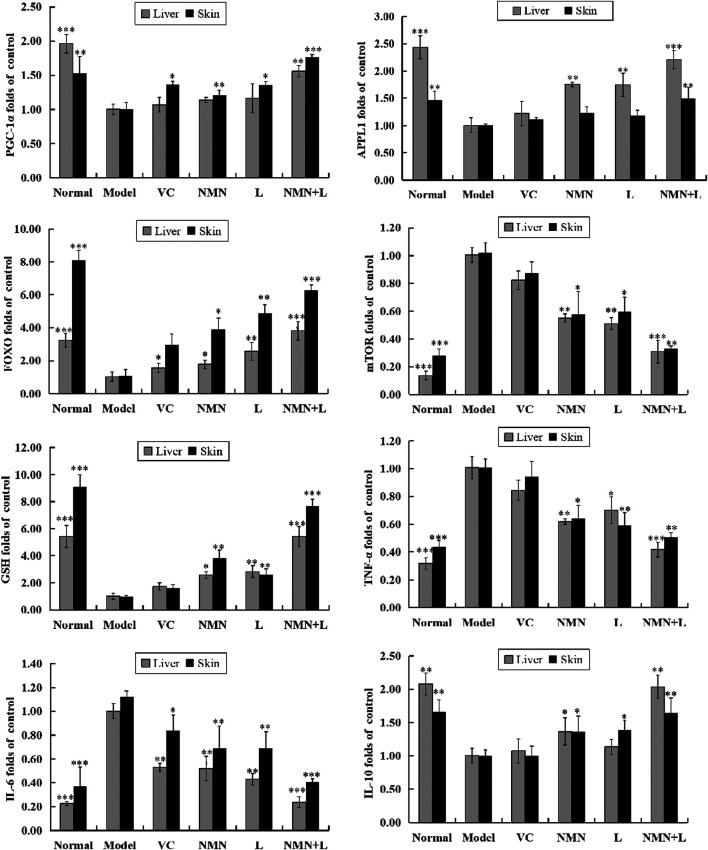
FIGURE 6.
PGC-1α, APPL1, mTOR, FOXO, TNF-α, IL-6, IL-10, and GSH mRNA expression levels in skin and liver tissues. The data were calculated and analyzed using Pad Prism 7.0 (Graph Pad Software, La Jolla, CA, United States) software, group differences were also analyzed by one-way analysis of variance (ANOVA) followed by Duncan’s multiple comparison test. *p < 0.05 compared to the model group; **p < 0.01 compared to the model group; ***p < 0.001 compared to the model group. VC: mice treated with vitamin C (300 mg/kg); NMN: mice treated with nicotinamide mononucleotide (300 mg/kg); L: mice treated with L. fermentum TKSN041 (1.0 × 10⁹ CFU/ml); NMN + L: mice treated with nicotinamide mononucleotide (300 mg/kg) and L. fermentum TKSN041 (1.0 × 10⁹ CFU/ml).

