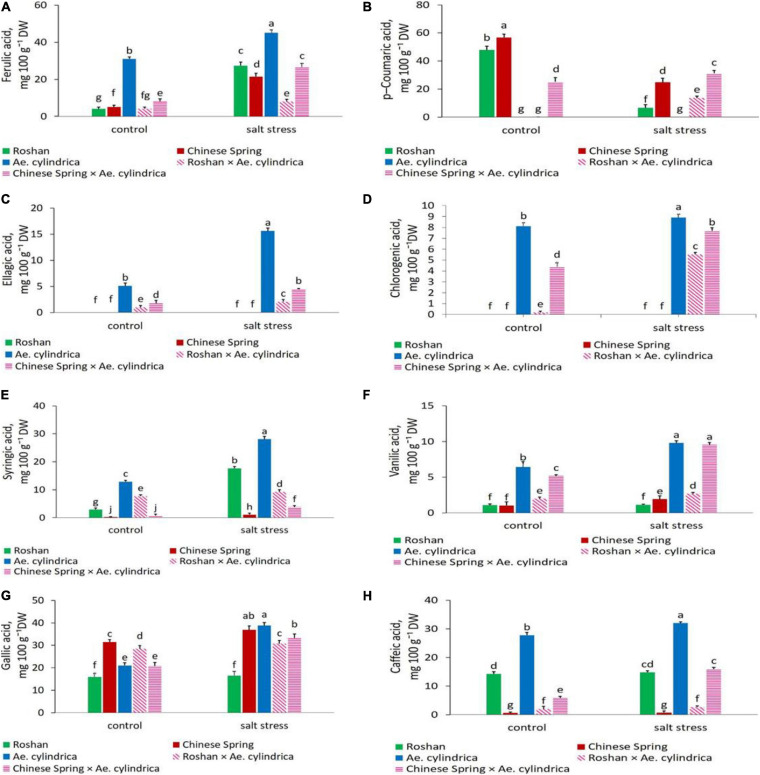
FIGURE 3.
Mean comparison of (A) ferulic acid, (B) p-coumaric acid, (C) ellagic acid, (D) chlorogenic acid, (E) syringic acid, (F) vanillic acid, (G) gallic acid, and (H) caffeic acid of parents (T. aestivum “Roshan,” “Chinese spring,” Ae. cylindrica) and their F1 hybrid plants (amphidiploids) under control and salt stress conditions. Bars represent means ± SE and bars with the same letter do not significantly differ at p < 0.05 among the genotypes.

