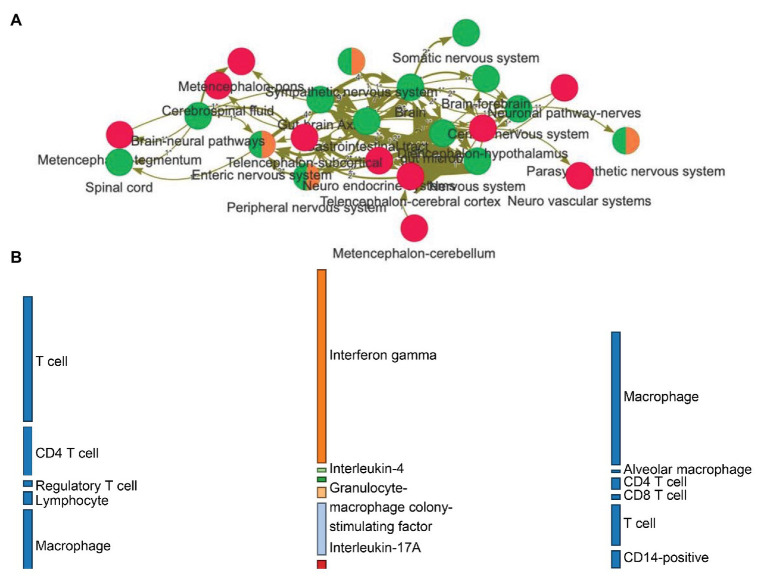
Figure 2.
(A) Network visualization of how entities (nodes) relate to each other (edges) based on relations expressed in natural language. The frequency of a relation among entities can be represented with a varying thickness. Red nodes are central nervous system-related entities, green ones represent gut/brain-related annotations, while orange nodes have been classified into the peripheral nervous system. (B) The linguistic relations from the graph can be organized into a flow diagram, allowing the exploration of the directed effects between biological domains. This example makes visible how families of cells are interacting onto cytokines (leftmost to middle layers) and then how and what cytokines related back to the host cells (middle to rightmost layers).

