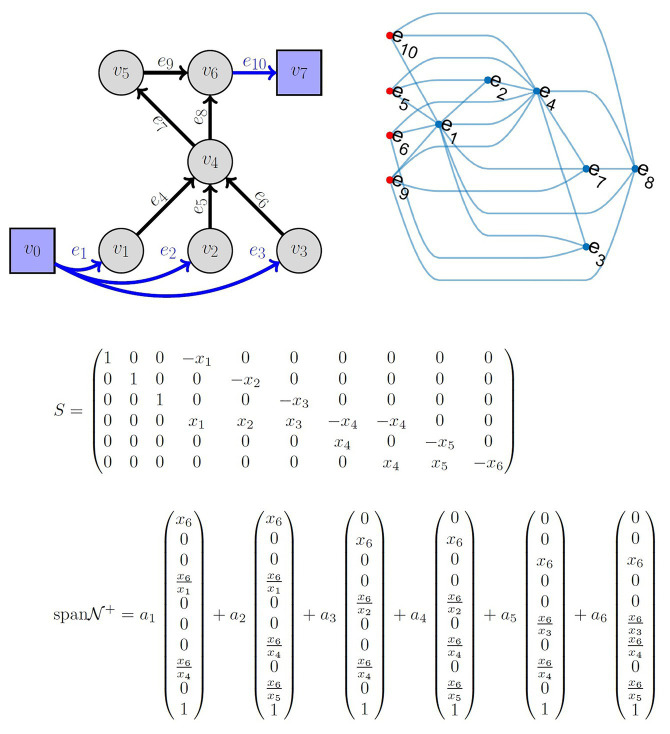
Figure 3.
Top left: Example of a metabolic network known as reverse cholesterol transport in humans, described in reference McQuade et al. (2017). Top right: Graph of flux correlations. The nodes correspond to edges from the network. The relationships between fluxes in a cholesterol metabolism model at equilibrium. Nodes in the graph are fluxes. Red nodes to the left indicate independent fluxes and blue nodes are dependent fluxes. An edge between a red node and another node indicates that the expression for the dependent flux contains the independent flux. Dependent fluxes have edges between them when they share a dependent flux. Middle: The matrix S is the linear-in-flux-expression (LIFE) version of the stoichiometric matrix corresponding to the top left network. x1 corresponds to v1, etc. Bottom: The span of the positive null space is shown. Note that the nullity of S is 4. However, the positive basis requires six positively independent elements. The positive basis permits choosing ai ≥0 results in flux vectors that lie in the null space of S and the positive orthant.

