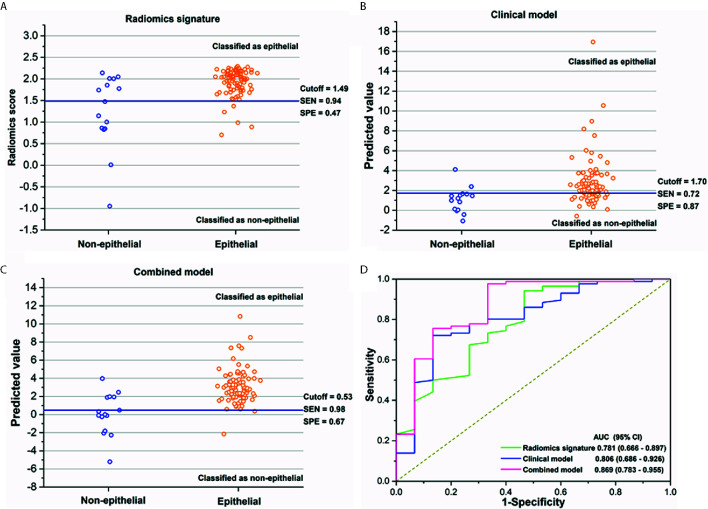
Figure 3.
(A–C) The performance of the radiomics signature, clinical model, and combined model for the discrimination of histological subtypes in each patient. The blue solid line indicates the best cutoff of the radiomics score or the predicted value of two models for the discrimination of histological subtypes; patients above the cutoff were classified as epithelial group, while patients below the cutoff were classified as non-epithelial group. (D) The receiver operating characteristics (ROC) curves with area under curves (AUCs) for radiomics signature, clinical factor model, and combined model of 0.781 (95% CI, 0.666–0.897), 0.806 (95% CI, 0.686–0.926), and 0.869 (95% CI, 0.783–0.955), respectively.

